
Early and unofficial 2026 solutions
Early Solutions to the 2026 AP Environmental Science FRQs | Step by Step
A complete student-friendly walkthrough of all three released FRQs, including the bird-distribution model, coral experiments, energy graph, eutrophication, ocelot calculations, trophic energy, and every required justification.
How to use these AP Environmental Science FRQ solutions
The command word controls the depth of the response. An identify prompt needs a direct, accurate statement. Describe states a relevant pattern or effect. Explain and justify must connect a cause to an environmental mechanism and then to its consequence. A calculation should show the setup, substituted values, arithmetic, and interpreted answer.
Question 1 - Design an investigation
Climate change, bird distributions, coral bleaching, and Arctic feedbacks
Parts A-E analyze predicted changes in bird ranges. Parts F-H interpret two coral-bleaching experiments. Parts I-J connect warming to Arctic feedbacks and species impacts.
Stimulus 1: Bird species distribution by elevation
Researchers mapped five bird species, A-E, across four elevation zones in a tropical mountain range and modeled their likely future distribution under climate change. Each unique silhouette represents one species; repeated silhouettes across elevations show range, not abundance.
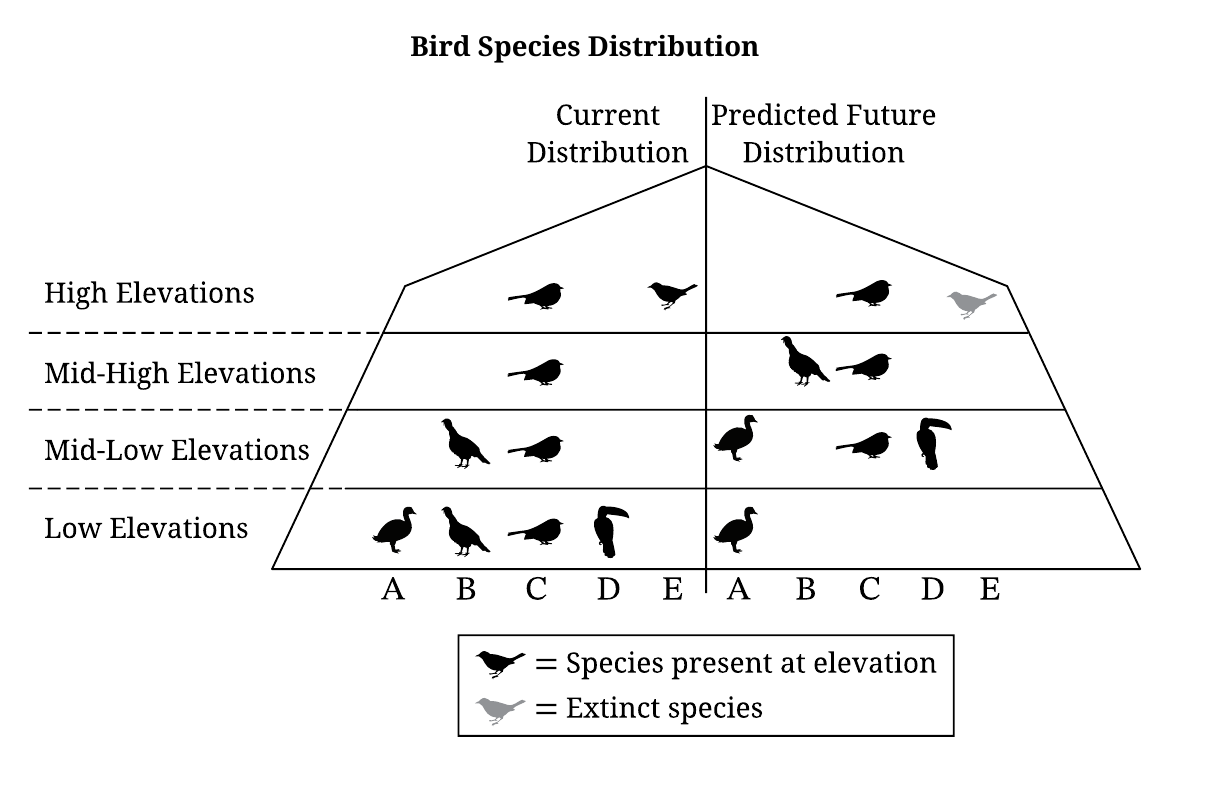
| Elevation zone | Current living species | Species richness |
|---|---|---|
| High | C, E | 2 |
| Mid-high | C | 1 |
| Mid-low | B, C | 2 |
| Low | A, B, C, D | 4 |
AHighest current species richness
Task: Based on the diagram, identify the elevation zone with the highest species richness in the current distribution.
- Species richness means the number of different species present, not the number of individual birds.
- The low-elevation zone contains species A, B, C, and D.
- Its richness is therefore 4, higher than the value for any other current zone.
BClimate at high elevation
Task: Describe one climate condition at high elevations that differs from conditions at low elevations.
- As elevation increases, air pressure decreases.
- Rising air expands and cools, so mountain climates are generally colder than nearby low-elevation climates.
CEffect on a low-elevation predator
Task: A low-elevation predator currently eats species C and D. Describe what could happen to that predator under the predicted prey changes.
- The predator currently depends on C and D as food.
- In the predicted future low-elevation zone, neither C nor D remains; only species A is shown.
- Loss of its established prey base reduces food availability, survival, and reproduction unless the predator switches prey or follows the prey upslope.
DGeneralist C versus specialist E
Task: Explain why species C, a generalist, and species E, a specialist, are predicted to respond differently to climate change.
- Species C currently occurs in all four elevation zones, evidence of a broad realized niche and wide climate tolerance.
- A generalist can usually use a wider range of habitats or resources, so C can shift upward and remain in several zones.
- Species E occurs only at high elevation, evidence of a narrow niche tied to cool mountaintop conditions.
- As suitable climate moves upslope, the available land area shrinks and ends at the summit. E has no higher habitat to occupy.
ELower resilience of the future bird community
Task: Explain why the future low-elevation bird community would be less likely to recover from natural disruptions.
- The current low-elevation community has four species; the predicted future community has only one.
- Greater biodiversity often provides functional redundancy: more than one species can perform similar ecological roles.
- With only one species, a drought, disease, fire, or severe storm affecting that species can remove most ecological function, so recovery is less likely.
Stimulus 2: Coral bleaching experiments
Researchers placed photosynthetic algae living symbiotically in corals into saltwater tanks. Water circulation mimicked ocean currents. After 30 days, they counted the bleached corals.
| Experiment | Tank 1 | Tank 2 | Tank 3 | Measured response |
|---|---|---|---|---|
| 1: Temperature test | 27°C, no sediment | 32°C, no sediment | 37°C, no sediment | Number of bleached corals after 30 days |
| 2: Sediment test | 27°C, no sediment | 27°C, moderate sediment | 27°C, high sediment | Number of bleached corals after 30 days |
FIndependent variable in Experiment 1
Task: Identify the independent variable.
- The independent variable is the factor deliberately changed by the researchers.
- Temperature changes from 27°C to 32°C to 37°C, while sediment is absent from every tank.
- The number of bleached corals is the dependent variable because it is measured.
GScientific question for Experiment 1
Task: Identify a likely scientific question.
- Name the manipulated variable: seawater temperature.
- Name the measured response: number of bleached corals after 30 days.
- Phrase the relationship as a testable question.
HEffect of the Experiment 2 modification
Task: Explain how holding temperature constant while varying sediment could affect the results.
- Experiment 2 changes only sediment amount; temperature stays at 27°C.
- Controlling temperature removes it as a confounding variable, so bleaching differences can be attributed more directly to sediment.
- Suspended sediment increases turbidity, reducing the light available to the corals' symbiotic photosynthetic algae.
- Lower photosynthesis reduces chemical energy supplied to coral. Sediment can also smother coral or interfere with feeding and gas exchange.
IIce-albedo positive feedback
Task: Describe a positive feedback loop caused by loss of polar ice and snow.
Bright ice reflects a large fraction of incoming sunlight. When it melts, darker ocean or land is exposed and absorbs more solar radiation. The added warming causes still more melting, amplifying the original change.
JProblem for an Arctic species
Task: Describe one problem that polar bears, ringed seals, or another Arctic species faces because of warming.
- Sea ice is habitat: it supplies hunting access, resting locations, breeding areas, and travel routes.
- Polar bears use sea ice as a platform for hunting ringed seals.
- With less ice, bears may swim farther and spend more energy while obtaining less food, harming body condition, reproduction, and survival.
Question 2 - Analyze a problem and propose a solution
U.S. energy consumption and nutrient pollution
Parts A-G interpret energy use and environmental impacts. Parts H-I trace eutrophication and propose a realistic agricultural solution with an additional benefit.
Stimulus: U.S. energy consumption, 1950-2020
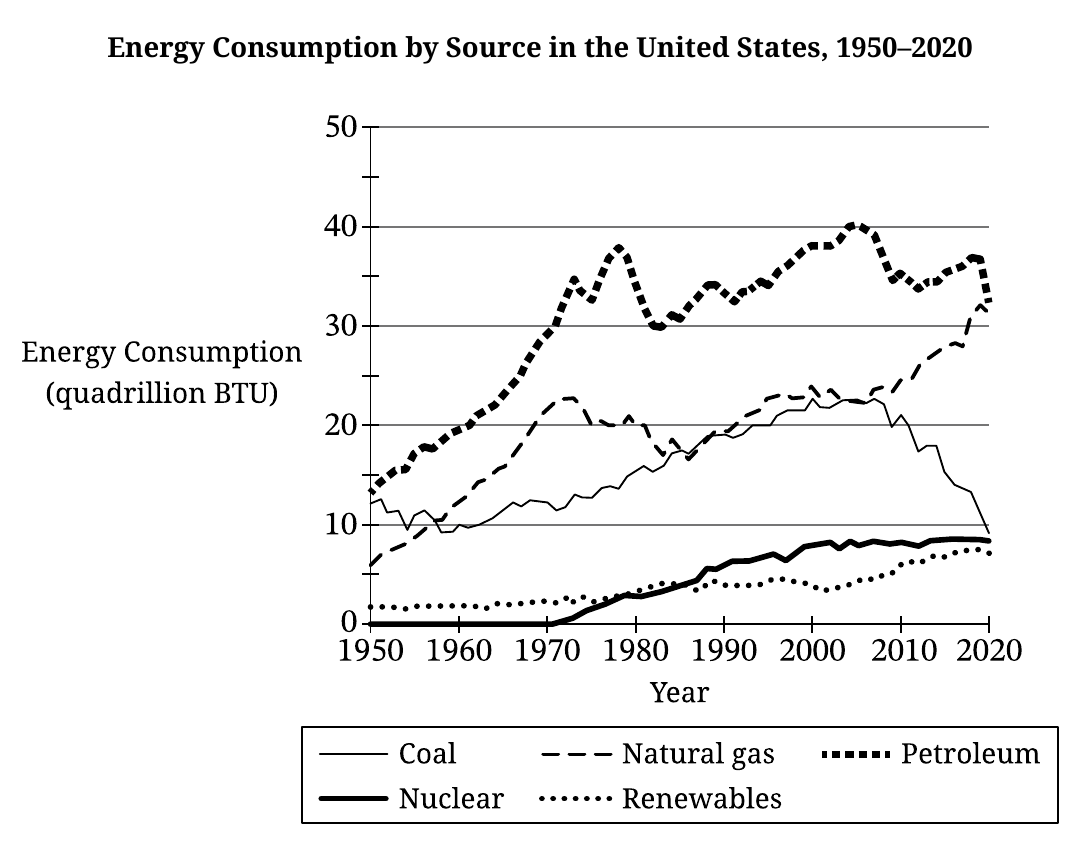
The graph reports U.S. consumption of coal, natural gas, petroleum, nuclear energy, and renewables in quadrillion British thermal units (BTU). Read both the line labels and the changes over time.
ARenewable source used for electricity
Task: Identify one renewable energy source used to generate electricity.
Wind is continually replenished by atmospheric circulation driven mainly by uneven solar heating. Moving air turns turbine blades, and the rotating shaft drives a generator.
BHighest consumption in 2010
Task: Identify the energy source with the highest consumption in 2010.
At 2010, the petroleum line is approximately 34 quadrillion BTU, above natural gas and coal in the low 20s, nuclear near 8, and renewables near 4-5.
CCoal-consumption pattern, 1960-2020
Task: Describe the pattern in U.S. coal consumption over the full interval.
- From about 1960 to the mid-2000s, coal consumption generally rose, with fluctuations, from roughly 9 to about 22-23 quadrillion BTU.
- After about 2010, coal consumption declined sharply to approximately 9 quadrillion BTU by 2020.
DWhy coal use changed from 2010 to 2020
Task: Explain one likely reason for the change in coal use.
- Hydraulic fracturing and horizontal drilling increased the supply of natural gas, lowering its price.
- Utilities replaced some coal-fired generation with natural-gas generation.
- Natural gas emits less sulfur pollution and less CO2 per unit of electricity than coal, adding an environmental and regulatory incentive.
- The graph is consistent with this mechanism because natural-gas use rises while coal use falls.
EHow fossil fuels generate electricity
Task: Explain the energy-conversion process.
- Combustion releases the fuel's chemical energy as heat.
- The heat boils water, creating high-pressure steam that spins a turbine.
- The turbine rotates a generator; a changing magnetic field induces an electric current.
- The electricity is transmitted through the grid.
FNegative impact of nuclear energy
Task: Identify one negative impact associated with nuclear energy.
Spent nuclear fuel remains radioactive for long periods. It needs engineered containment, monitoring, and protection against leakage, accidents, and unauthorized access.
GEnvironmental problem from ocean warming
Task: Describe one problem other than coral bleaching.
- Water expands as its temperature increases; this process is called thermal expansion.
- Thermal expansion raises sea level.
- Higher sea level increases coastal flooding and erosion and can push salt water into freshwater aquifers and wetlands.
Stimulus: Nutrient increase near converted agricultural land
Researchers found more nitrates and phosphates in an aquatic ecosystem near land converted to agriculture. The response must trace what those nutrients do after entering the water, not stop at “more algae.”
HHow excess nutrients harm an aquatic ecosystem
Task: Explain the negative effect of increased nitrates and phosphates.
Rapid algal growth also increases turbidity and blocks light. When the bloom and shaded plants die, decomposer bacteria consume the biomass and use dissolved oxygen. Hypoxic or anoxic water cannot support many fish and invertebrates.
I(i)Solution that still permits crop cultivation
Task: Propose a realistic solution to reduce nutrient pollution while still allowing crops to be grown.
- Keep most of the field in cultivation.
- Establish strips of grasses, shrubs, or trees between the cropped land and nearby streams.
- The vegetation slows runoff, increases infiltration, absorbs nutrients through roots, and traps nutrient-rich sediment before it reaches the water.
I(ii)Additional advantage of the solution
Task: Justify the buffer-strip solution with an advantage other than reducing nutrient runoff.
- Plant roots bind soil particles and stabilize field margins and streambanks.
- Less soil erosion preserves fertile topsoil, supporting long-term agricultural productivity.
- The buffer may also create habitat and a movement corridor for wildlife, but one explained advantage is enough.
Question 3 - Analyze a problem with calculations
Ocelots, population change, trophic energy, and habitat connectivity
Ocelots formerly occurred in 25 Texas counties. Land-use change has left 74 individuals in only 4 counties. Pocket mice are their main prey, and vehicle collisions are the leading cause of death.
Food-web and calculation facts
AConsequence of a smaller ocelot population
Task: Identify one environmental consequence.
- Ocelots exert top-down control on pocket mice.
- Fewer ocelots reduce predation, so pocket-mouse abundance may rise.
- More herbivorous rodents consume more plants and seeds, reducing shrubland biomass and altering habitat for other species.
BPercent change in occupied counties
Task: Calculate the percent change from the historical 25 counties to the current 4 counties. Show the work.
The negative sign means the number decreased. State either “-84%” or “an 84% decrease,” not “a -84% decrease.”
CPopulation doubling time
Task: Calculate how long the population takes to double at a constant annual growth rate of 2.8%.
Method 1: Rule of 70
Method 2: Exact compound-growth check
The exact result confirms the Rule-of-70 estimate.
DEnergy if ocelots ate only carnivores
Task: Explain how the primary-production energy available to ocelots would change if they ate carnivorous snakes instead of pocket mice.
- Pocket mice eat plants, so they are primary consumers. Eating them gives the ocelot a relatively short food chain.
- A carnivorous snake has already consumed another animal. Eating it adds at least one trophic transfer before energy reaches the ocelot.
- At every transfer, most energy is used in metabolism or lost as heat and waste; only about 10% is commonly approximated as available to the next trophic level.
EPocket mice consumed per day
Task: An ocelot eats 720 g of food per day; 46% is pocket mice by weight; each mouse averages 43 g. Calculate the number of mice.
- Find the daily mass of pocket mice: 720 g × 0.46 = 331.2 g.
- Divide by mass per mouse.
The calculation gives 7.70 mice. In this counting context, report approximately 8 whole mice per day.
F(i)Solution to vehicle collisions
Task: Propose a realistic solution that reduces ocelot deaths from vehicles.
- Use collision records, tracking data, and habitat corridors to locate frequent crossing points.
- Build wildlife underpasses or overpasses at those locations.
- Add roadside fencing that guides ocelots toward the safe passages instead of allowing them onto the roadway.
F(ii)Additional advantage of wildlife crossings
Task: Explain one advantage other than reducing road deaths.
- Roads fragment habitat and restrict movement between population groups.
- Crossings reconnect fragments, allowing ocelots to reach mates, prey, and other resources.
- Movement between groups increases gene flow, which can reduce inbreeding and help maintain genetic diversity in this very small population.
Final AP-style response checklist
- Label every part and subpart clearly.
- Answer “identify” prompts directly.
- Give a cause-and-effect mechanism for “explain” and “justify.”
- Describe the full time interval and major pattern change in a graph.
- Separate independent, dependent, and controlled variables.
- Show formula, substitution, arithmetic, and interpretation.
- Translate a negative percent change into a percent decrease.
- Give a distinct additional advantage when the prompt requests one.
- Trace nutrient pollution through decomposition and oxygen loss.
- Give only the requested number of examples.
Continue your AP Environmental Science review
These FRQs combine material from ecosystems, biodiversity, energy resources, pollution, and global change. Review the matching units, then return to the released questions and practice writing each answer without looking at the model response.
Content basis: the user-supplied AP Environmental Science 2026 FRQ Detailed Solutions PDF. Prompt wording and figures were cross-checked against the released 2026 AP Environmental Science free-response question paper. This page remains an independent educational guide, not an official scoring document.