
The Living World: Ecosystems
APES Unit 1 Study Notes
Understand the connections that sustain life.
Explore ecosystems, biomes, nutrient cycles and energy flow with detailed notes, worked examples and clear diagrams.
1.1 Introduction to Ecosystems
What is an Ecosystem?
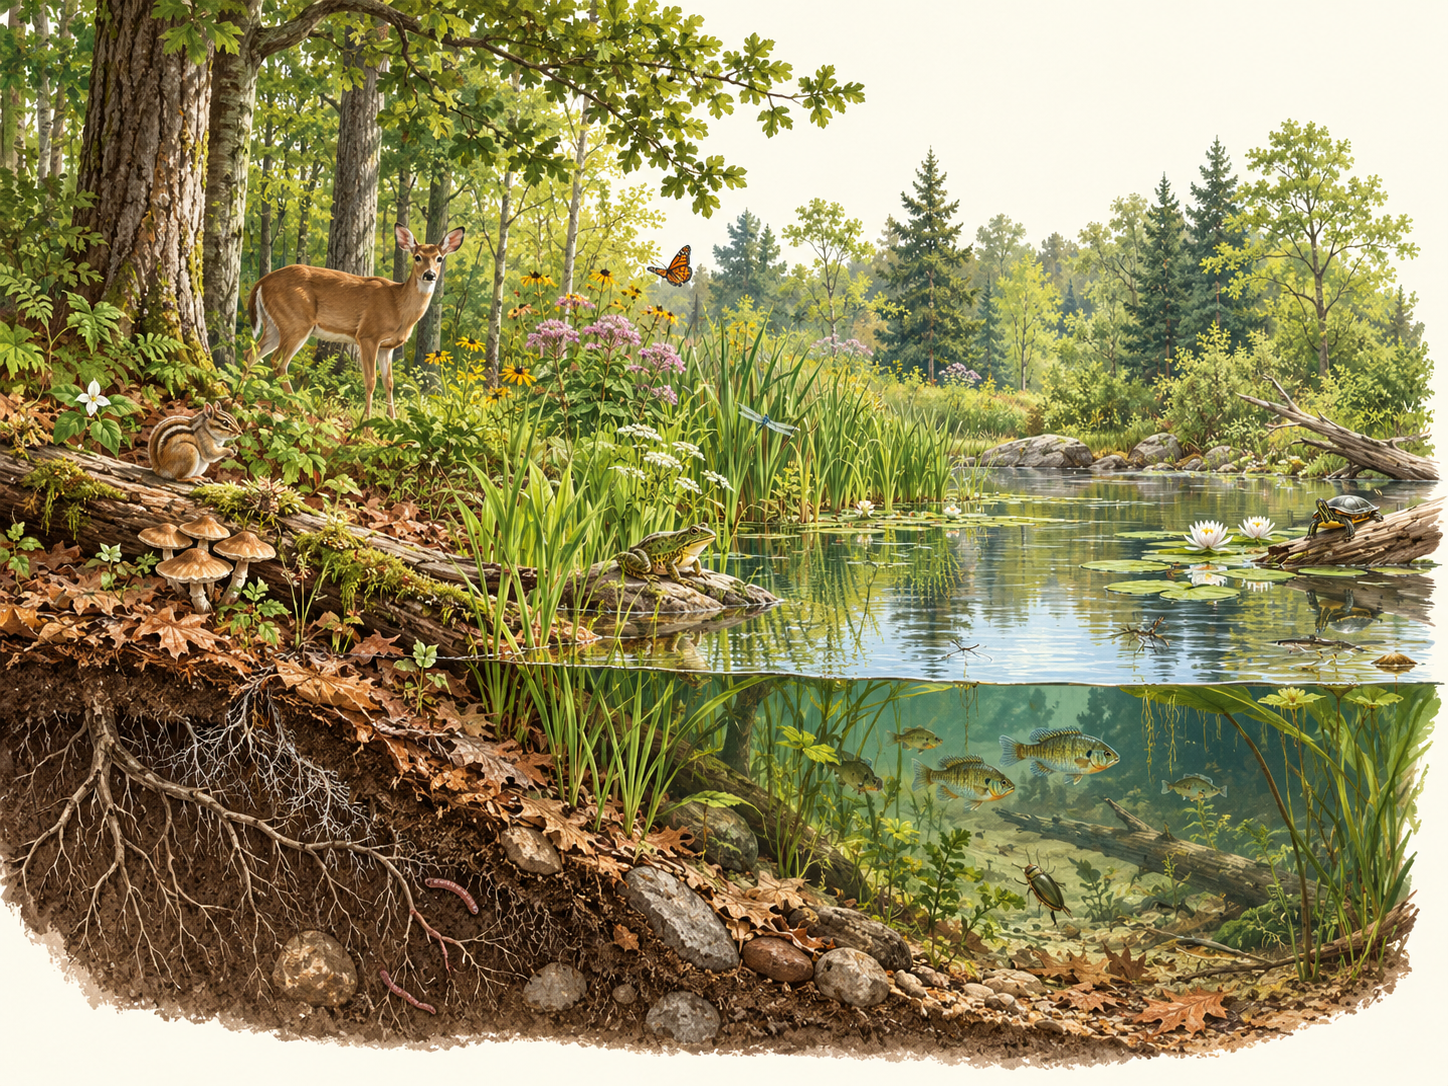
An ecosystem is a biological community of interacting organisms and their physical environment. It includes all living (biotic) and non-living (abiotic) components in a particular area that work together as a functional unit. Ecosystems can range in size from a small pond to an entire forest, and they are the fundamental units of organization in environmental science.
Understanding ecosystems is crucial for the AP Environmental Science exam because it forms the foundation for studying energy flow, nutrient cycling, and environmental interactions throughout the course.
Biotic Factors
Biotic factors are the organisms and biological interactions in an ecosystem. Useful functional groups include producers and heterotrophs; consumers, detritivores and decomposers describe different feeding roles, not mutually exclusive taxonomic categories.
- Producers (Autotrophs): Organisms that make organic food using light energy (photosynthesis) or energy from inorganic chemical reactions (chemosynthesis). Plants, algae and cyanobacteria are familiar examples. Producers supply new organic matter to most food webs; chemosynthetic microbes support some ecosystems without sunlight.
- Consumers (Heterotrophs): Organisms that obtain energy by consuming other organisms. They are further divided into herbivores (plant-eaters), carnivores (meat-eaters), omnivores (eat both plants and animals), and detritivores (feed on dead organic matter).
- Decomposers: Mainly bacteria and fungi that digest organic material externally and absorb the products. Mineralization releases inorganic nutrients into soil or water, making them available again to producers. Decomposers are heterotrophs and also respire; they recycle matter rather than return usable energy to the Sun.
💡 Exam Tip: Remember that decomposers are different from detritivores. Decomposers chemically break down matter at a molecular level, while detritivores physically consume dead material. Both are essential for nutrient recycling!
Abiotic Factors
Abiotic factors are all the non-living physical and chemical components of an ecosystem that influence living organisms. These factors determine which species can survive in a particular environment and shape ecosystem characteristics. Key abiotic factors include:
- Sunlight: Primary energy source for most ecosystems; drives photosynthesis and influences temperature
- Temperature: Affects metabolic rates, species distribution, and determines biome classification
- Water: Essential for all life; availability determines ecosystem productivity and species composition
- Soil: Soil texture, mineral content, moisture and pH are abiotic properties. Soil also contains living roots, microbes and animals, so soil as a whole is a mixture of biotic and abiotic components.
- Nutrients: Chemical elements (nitrogen, phosphorus, carbon) required for organism growth
- pH: Acidity or alkalinity of soil and water affects organism survival and nutrient availability
- Salinity: Salt concentration in water determines which aquatic organisms can survive
- Oxygen: Necessary for aerobic respiration; levels vary in aquatic ecosystems
Species interactions, niches and resource partitioning
A habitat is where an organism lives; its ecological niche includes its resource use, environmental tolerances and interactions. A species can be limited by both abiotic conditions and other organisms. Explain a mechanism rather than simply naming the interaction.
| Interaction | Effect | Example and reasoning |
|---|---|---|
| Competition | − / − | Two species use a limited seed supply; each reduces resources available to the other. Competition may also occur within a species. |
| Predation / herbivory | + / − | A frog gains energy by eating an insect; a caterpillar gains energy by eating a leaf. The consumed organism or tissue is harmed. |
| Mutualism | + / + | Mycorrhizal fungi receive plant sugars while helping roots obtain mineral nutrients. |
| Commensalism | + / 0 | An epiphyte gains support on a tree without a measurable effect on the tree in the stated example. |
| Parasitism | + / − | A tick obtains blood from a host, imposing a cost without necessarily killing it immediately. |
Resource partitioning reduces overlap in resource use: species may feed in different parts of a tree, at different times, or on different-sized prey. It can allow coexistence. If species overlap completely in their use of a limiting resource, competitive exclusion may result under stable conditions; real environments can vary through time and space.
Apply it: Two birds eat insects on the same tree. If one feeds mainly in the upper canopy and the other near the trunk, spatial partitioning can reduce competition. Both species still interact with the same ecosystem.
1.2 Terrestrial Biomes
Understanding Biomes
Terrestrial biomes are large geographical regions on Earth characterized by distinct climate conditions, particularly temperature and precipitation patterns. These two factors are the primary determinants of biome classification and dictate which plant and animal species can survive in each region. The same biome can occur in geographically distant areas with similar climates.
For the AP Environmental Science exam, you must understand the distinguishing features of each major terrestrial biome, including climate data, characteristic vegetation, and typical biodiversity levels.
Tropical Rainforest
Warm throughout the year, commonly around 20–30°C; daily and regional variation occurs.
Usually high, often more than 200 cm/year; the seasonal distribution matters as well as the annual total.
Location: Near the equator (Amazon Basin, Congo Basin, Southeast Asia)
Characteristics: Very high terrestrial biodiversity and a long growing season. Many tropical wet forests remain warm and moist throughout the year, although rainfall seasonality varies. Emergent trees, canopy, understory and forest-floor layers create different light environments. Rapid uptake, decomposition and leaching can leave deeply weathered soils nutrient-poor despite nutrient-rich living biomass. Broad evergreen leaves and drip tips are common adaptations.
Exam focus: Tropical rainforests often have high NPP per unit area because water and suitable temperatures support a long growing season. Productivity still depends on light and nutrient supply. Deforestation removes habitat and biomass carbon; high biodiversity does not imply that the soil is uniformly fertile.
Desert
Hot or cold depending on location; large daily or seasonal ranges are common. The Gobi is an example of a cold desert.
Very low, commonly below about 25 cm/year. Low precipitation relative to potential evaporation is a key feature.
Location: Many subtropical deserts occur near 30° N or S (Sahara, parts of the Mojave). Others reflect rain shadows, continental interiors or cold coastal currents (Gobi, Atacama). Latitude alone does not identify every desert.
Characteristics: Lowest precipitation of all biomes. Low biodiversity with highly adapted species. Sparse vegetation including cacti, succulents, and drought-resistant shrubs. Plants have adaptations like CAM photosynthesis, water storage, extensive root systems, and reduced leaf surface area. Animals are often nocturnal to avoid extreme daytime heat.
Exam focus: Descending subtropical air, rain shadows and other climate controls can create dry conditions. Desert NPP per unit area is generally low and often responds rapidly to rain. Desertification is degradation of drylands through interacting land-use and climate pressures; it is not simply the natural presence of a desert.
Temperate Grassland (Prairie)
Hot summers, cold winters
25-75 cm/year (10-30 inches)
Location: Interior of continents (North American Great Plains, Eurasian Steppe, Pampas)
Characteristics: Grasses and herbaceous plants dominate, with tree cover limited by climate, fire and grazing. Deep roots add organic matter to often fertile grassland soils, including many mollisols. Bison and antelope are grazers; prairie dogs are smaller herbivorous burrowing mammals. Fire and grazing can maintain grassland structure, but frequency and intensity matter.
Exam Focus: Often converted to agriculture (breadbaskets of the world). Fire is a natural disturbance that maintains the ecosystem. Susceptible to soil erosion when plowed.
Temperate Deciduous Forest
Warm summers, cold winters (4 seasons)
75-150 cm/year (30-60 inches)
Location: Eastern North America, Western Europe, Eastern Asia
Characteristics: Broad-leaved trees such as oak, maple and beech shed leaves seasonally. Leaf litter supplies organic matter and nutrients; soil fertility varies with climate, parent material and land use. Canopy, understory and ground layers provide different habitats. Warm growing seasons alternate with a dormant season.
Exam Focus: Moderate NPP. Trees are deciduous to reduce water loss when soil freezes. Many areas have been cleared for human development and agriculture.
Taiga/Boreal Forest
Long winters often well below 0°C; short, cool to mild summers. A summer range must not be mistaken for the annual range.
Moderate to low, often around 30–85 cm/year, as rain and snow; proportions vary geographically.
Location: Northern Canada, Scandinavia, Russia (between 50-60°N latitude)
Characteristics: A vast high-latitude forest belt dominated by conifers such as spruce, fir and pine, with regional deciduous trees such as larch and birch. Needle leaves can reduce water loss; conical form and flexible branches help shed snow. Short growing seasons and slow decomposition often produce acidic soils and large carbon stores. Biodiversity is generally lower than in tropical forests.
Exam Focus: Coniferous trees are adapted to cold with needle leaves and flexibility. Important for timber industry and carbon storage. Vulnerable to climate change impacts.
Tundra
<0°C much of year; extremely cold
15-25 cm/year (<10 inches)
Location: Arctic regions above 60°N (northern Alaska, Canada, Russia, Greenland)
Characteristics: Arctic tundra is largely treeless and commonly underlain by permafrost: ground remaining at or below 0°C for at least two consecutive years. A surface active layer thaws seasonally. Mosses, lichens, sedges, grasses and dwarf shrubs tolerate cold, wind and a short growing season. Caribou, Arctic foxes and migratory birds are examples; polar bears depend especially on sea-ice food webs. Alpine tundra occurs above treeline and does not always have permafrost.
Exam focus: Low temperatures, a short growing season and often restricted root depth limit productivity. Tundra NPP per unit area is low, but it is not universally lower than every desert. Thawing permafrost can release CO₂ and, where conditions favour anaerobic production, methane; hydrology influences the outcome.
Savanna (Tropical Grassland)
24-29°C (75-84°F) year-round
51-127 cm/year (seasonal wet/dry)
Location: Sub-Saharan Africa, South America, Australia
Characteristics: Grassland with scattered individual trees (not dense enough to form canopy). Distinct wet and dry seasons. Frequent fires during dry season maintain grassland by preventing tree dominance. Large herds of grazing mammals (zebras, wildebeest, elephants). Predators include lions, cheetahs, and hyenas.
Exam Focus: Fire and grazing are essential disturbances that maintain savanna structure. Seasonal rainfall patterns drive migration of herbivores.
Chaparral (Mediterranean woodland and shrubland)
Climate and location: Mild, wetter winters and hot, dry summers; examples include the Mediterranean Basin, coastal California, central Chile, southwestern Australia and the Cape region of South Africa. Annual totals alone can resemble another biome, so the summer drought is a useful clue.
Vegetation and adaptations: Dense drought-tolerant shrubs and small trees often have small, leathery leaves. Many species resprout or recruit after fire. Fire is part of many systems, but unusually frequent fires can prevent recovery and favour invasive grasses.
Exam focus: Link seasonal water limitation, leaf traits and fire regimes. Urban development, habitat fragmentation and altered fire frequency are major pressures.
Temperate Rainforest
Climate and location: Mild maritime temperatures with abundant precipitation and often fog; examples include the Pacific Northwest of North America, southern Chile and parts of New Zealand.
Characteristics: Large evergreen trees, mosses and ferns can support high standing biomass and substantial carbon storage. Cool conditions can slow decomposition compared with tropical wet forests. High biomass, species richness and NPP measure different things: a forest can store much biomass without having the highest current production rate.
1.3 Aquatic Biomes
Overview of Aquatic Biomes
Aquatic biomes include freshwater and marine systems and are classified using salinity, depth, flow, light, substrate and distance from shore. Oceans cover about 71% of Earth’s surface; freshwater habitats add a much smaller surface area. Local conditions and seasonality affect which organisms and processes dominate.
Key factors affecting aquatic biomes:
- Salinity: Freshwater has very low dissolved salt, commonly below about 0.5 parts per thousand in ecological classifications; seawater averages about 35 parts per thousand (3.5%). Some freshwater definitions use a 1,000 mg/L total-dissolved-solids threshold. State the units and the classification used; 1% is 10 parts per thousand and is too high as a general freshwater cutoff.
- Depth: Determines light penetration (photic vs. aphotic zones)
- Turbidity: Water clarity affects photosynthesis rates
- Nutrient availability: Influences productivity
- Temperature: Affects dissolved oxygen and metabolic rates
Freshwater Biomes
Streams and Rivers
Characteristics: Streams and rivers are flowing (lotic) systems. Turbulence can promote oxygen exchange and reduce stratification, but flow speed, pools, temperature and organic loading vary. A river is not guaranteed to be uniformly oxygen-rich or unstratified.
Headwaters (source): Cold, clear, fast-flowing, high oxygen, rocky substrate
Downstream: Warmer, slower flow, higher turbidity, more nutrients, muddy substrate
Lakes and Ponds
Characteristics: Standing (lentic) freshwater systems. Lakes are larger and deeper than ponds. Stratified into distinct zones based on light penetration and depth.
Lake Zones (important for exam!):
- Littoral zone: Shallow nearshore water where enough light reaches the bottom for rooted aquatic plants. It can be highly productive, but the fraction of whole-lake photosynthesis occurring here varies with lake shape and conditions.
- Limnetic Zone: Open water surface area; extends to depth of light penetration; dominated by phytoplankton (algae) and zooplankton
- Profundal zone: Deeper water with insufficient light for net photosynthetic production. Oxygen can be depleted during stratification as decomposition continues, but it is not always absent; mixing and lake productivity matter.
- Benthic Zone: Bottom sediments across all depths; detritus accumulates; inhabited by bottom-dwellers (benthic organisms) like insect larvae, worms, and bacteria
Lake Productivity Classification: Oligotrophic (low nutrients, clear water, low productivity) → Mesotrophic (moderate) → Eutrophic (high nutrients, murky water, high productivity, algal blooms)
Freshwater Wetlands
Characteristics: Areas where soil is saturated with water for all or part of the year. Include marshes, swamps, and bogs.
Ecological importance: Many marshes and swamps have high productivity, while nutrient-poor bogs can be less productive. Wetlands can retain sediment, transform nutrients, store floodwater and provide habitat. Their ability to improve water quality is finite and depends on hydrology, vegetation and the pollutant; they do not remove every contaminant.
Exam Focus: Wetlands are often called "nature's kidneys" because they filter water. Many have been drained for agriculture and development, leading to habitat loss and increased flooding.
Marine Biomes
Oceans (Open Water)
Characteristics: Saltwater ecosystems covering ~70% of Earth's surface. High salinity (~3.5%). Divided into zones by depth and distance from shore.
Depth Zones:
- Photic (euphotic) zone: Water receiving enough light for net photosynthetic production. In clear ocean water it can extend to roughly 200 m, but in turbid water it is much shallower. High light does not guarantee high productivity when nutrients are limiting.
- Aphotic zone: Water below the productive light zone, with insufficient light for photosynthesis; depth varies with clarity. Food can arrive as sinking organic material or through active transport, and some habitats are supported by chemosynthetic production. Twilight is not the same as enough light for net production.
Habitat position: water column and bottom
- Pelagic zone: The water column, including coastal (neritic) and offshore (oceanic) waters. Plankton drift with currents; nekton such as fish and whales swim actively. Pelagic describes position in the water column, not a fixed light level.
- Benthic zone: The bottom substrate at any depth. Shallow benthic habitats may be well lit; deep benthic habitats are usually cold, dark and under high pressure. Benthic and aphotic are therefore not synonyms.
Coral Reefs
Location: Shallow, warm tropical and subtropical waters (typically between 30°N and 30°S latitude)
Characteristics: Shallow warm-water coral reefs have exceptionally high marine biodiversity. Coral animals build calcium carbonate skeletons and commonly host photosynthetic symbionts (zooxanthellae), which supply much of their energy. Efficient nutrient recycling supports production in often nutrient-poor water. Light, temperature, sediment and salinity affect reef distribution; cold-water and deep-sea corals also exist and need not depend on photosymbionts.
Exam focus: Warming, acidification, sediment, pollution and physical damage can stress reefs. Bleaching is loss of photosymbionts or their pigments, reducing an important energy supply. Bleached coral is not necessarily dead and can recover if conditions improve; prolonged stress increases mortality risk.
Estuaries
Characteristics: Areas where freshwater from rivers meets and mixes with saltwater from the ocean. Salinity varies with tides, river flow, and location. Experience regular tidal fluctuations.
Ecological Importance: Among the most productive ecosystems on Earth due to high nutrient input from rivers. Serve as nurseries for many commercially important fish and shellfish species. Filter pollutants before they reach open ocean. Support diverse communities including salt marsh grasses, mangroves (in tropics), oysters, crabs, and waterfowl.
Exam Focus: Estuaries are highly productive but vulnerable to pollution from upstream sources. Many have been filled or dredged for development. Mangroves in tropical estuaries provide coastal protection from storms and erosion.
1.4 The Carbon Cycle
Overview
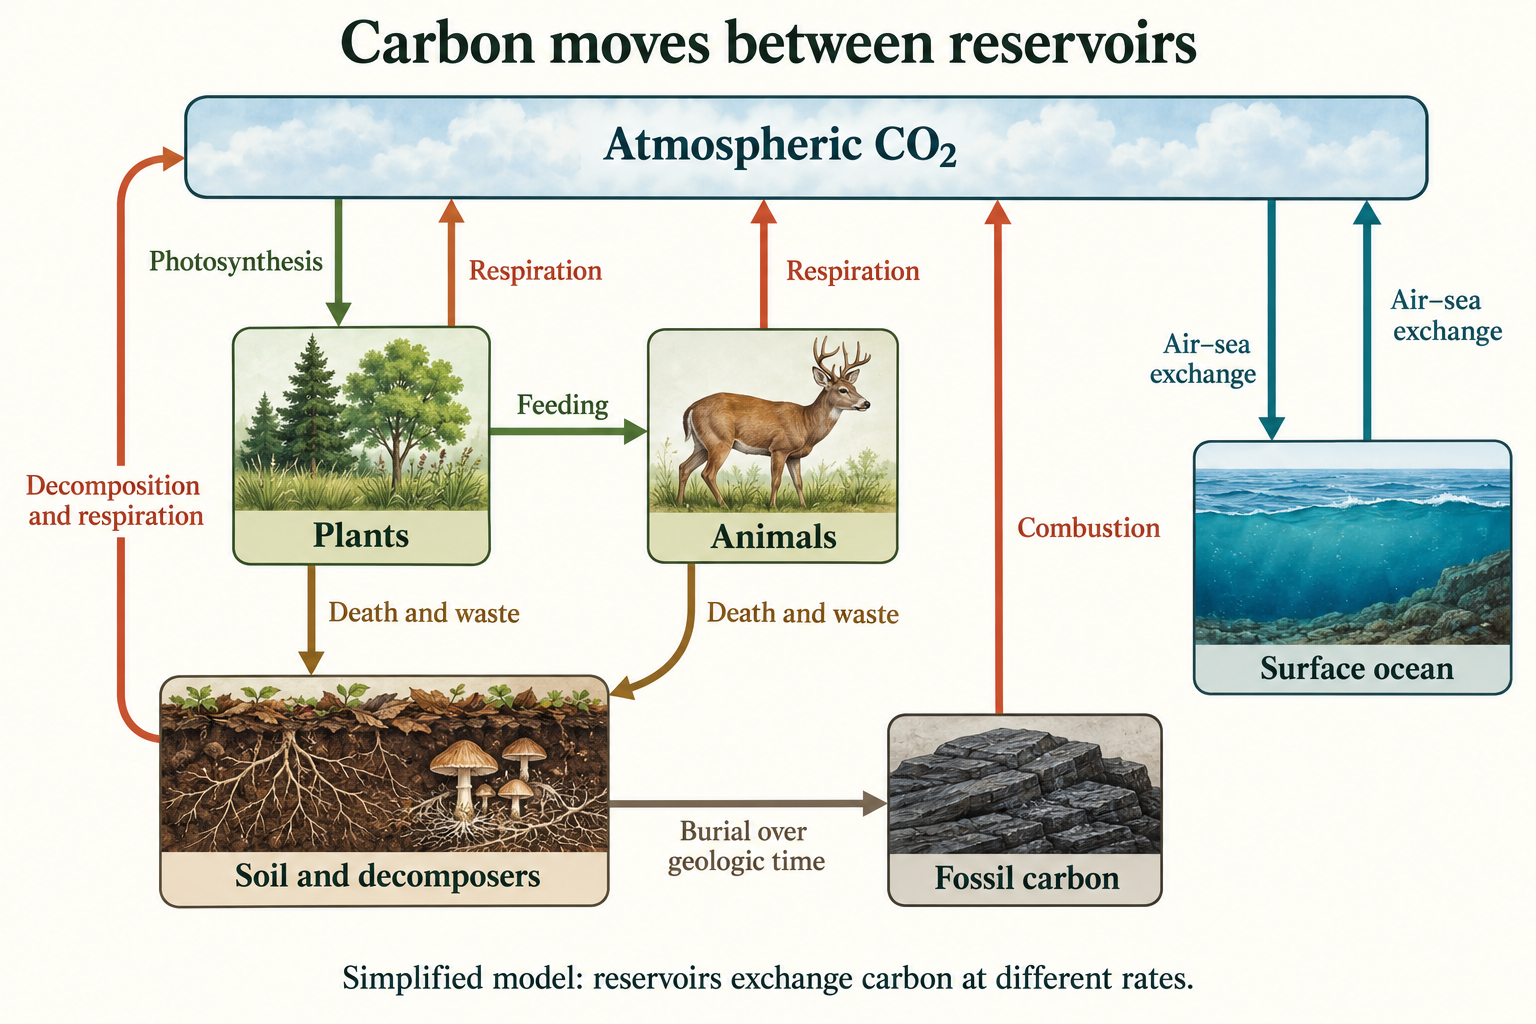
The carbon cycle describes the movement of carbon atoms through Earth's atmosphere, biosphere, hydrosphere, and geosphere. Carbon is the fundamental building block of all organic molecules (carbohydrates, proteins, lipids, nucleic acids) and is essential for all life. The carbon cycle has both fast (biological) and slow (geological) components.
Major Carbon Reservoirs: Atmosphere (as CO₂), oceans (dissolved CO₂ and carbonate), fossil fuels (coal, oil, natural gas), rocks and sediments (limestone), soil organic matter, living organisms (biomass).
Key Processes in the Carbon Cycle
1. Photosynthesis (Carbon Fixation)
Process: Plants, algae, and photosynthetic bacteria convert atmospheric CO₂ and water into glucose (C₆H₁₂O₆) and oxygen using sunlight energy.
Equation:
6CO₂ + 6H₂O + light energy → C₆H₁₂O₆ + 6O₂
Importance: Removes CO₂ from atmosphere. Stores carbon in organic compounds (biomass). Primary producers form the base of food chains.
2. Cellular Respiration
Process: Plants, animals and many microbes obtain usable energy by breaking down organic molecules. The equation below represents aerobic respiration, which uses oxygen and releases CO₂ and water. Respiration includes other pathways in some organisms, and not every living cell performs this exact oxygen-based reaction.
Equation:
C₆H₁₂O₆ + 6O₂ → 6CO₂ + 6H₂O + energy (ATP)
Importance: Aerobic respiration returns carbon to air or water and transfers chemical energy to ATP and heat. Photosynthetic organisms also respire, both day and night. The overall glucose-based equations for photosynthesis and aerobic respiration are complementary, but the pathways use different enzymes and energy transfers.
3. Decomposition
Process: Decomposers (bacteria and fungi) break down dead organic matter (plants, animals, waste) through cellular respiration, releasing CO₂ back to the atmosphere.
Importance: Decomposition releases inorganic nutrients, contributes to soil organic matter and returns carbon through respiration. Anaerobic breakdown can produce CO₂ and, where methanogenic archaea are active, CH₄. Methane production is not an automatic replacement of all CO₂ production in every oxygen-poor environment.
4. Combustion (Burning)
Process: Combustion is rapid oxidation of organic material, such as wood or fossil fuels, releasing CO₂ and energy; incomplete burning can also produce CO and particles. Wildfires are an example. Volcanic CO₂ comes from geologic degassing, not burning organic matter.
Importance: Major contributor to increased atmospheric CO₂. Human combustion of fossil fuels has significantly altered the carbon cycle, contributing to climate change.
5. Ocean Exchange (Diffusion)
Process: CO₂ dissolves in ocean water and is exchanged between atmosphere and ocean surface. Cold water absorbs more CO₂ than warm water. Some dissolved CO₂ forms carbonic acid (H₂CO₃), contributing to ocean acidification.
Importance: Oceans are a large active carbon reservoir and a net sink for part of human CO₂ emissions; carbonate rocks and sediments store more carbon over geologic timescales. A reservoir is a stock, whereas a sink is a net uptake over a stated interval. Phytoplankton fix dissolved inorganic carbon into biomass. Calcifying organisms use calcium and carbonate to form shells and skeletons; calcification is not the same process as photosynthesis.
Human Impacts on the Carbon Cycle
- Fossil Fuel Combustion: Releases ancient carbon stored underground for millions of years, rapidly increasing atmospheric CO₂ levels
- Deforestation: Reduces photosynthesis capacity and releases stored carbon from trees when burned or decomposed
- Agriculture: Tilling soil releases soil carbon; livestock produce methane (CH₄), a potent greenhouse gas
- Climate Change: Elevated CO₂ levels trap heat (greenhouse effect), warming Earth's climate
Geologic storage, sedimentation and uplift
Some organic material is buried and, under suitable geologic conditions over long periods, contributes to fossil-fuel deposits. Much buried carbon is not converted to a usable fuel. Carbonate shells can become sedimentary rock. Weathering, erosion, transport, burial, uplift and geologic degassing connect slow reservoirs to the surface system.
Worked carbon budget: In a hypothetical year, a forest fixes 1,200 g C/m² and returns 900 g C/m² through total ecosystem respiration. With no harvest, fire or other transfers specified, net ecosystem uptake is 300 g C/m²/year. This is a whole-ecosystem budget, not NPP: NPP subtracts only producer respiration.
1.5 The Nitrogen Cycle
Overview
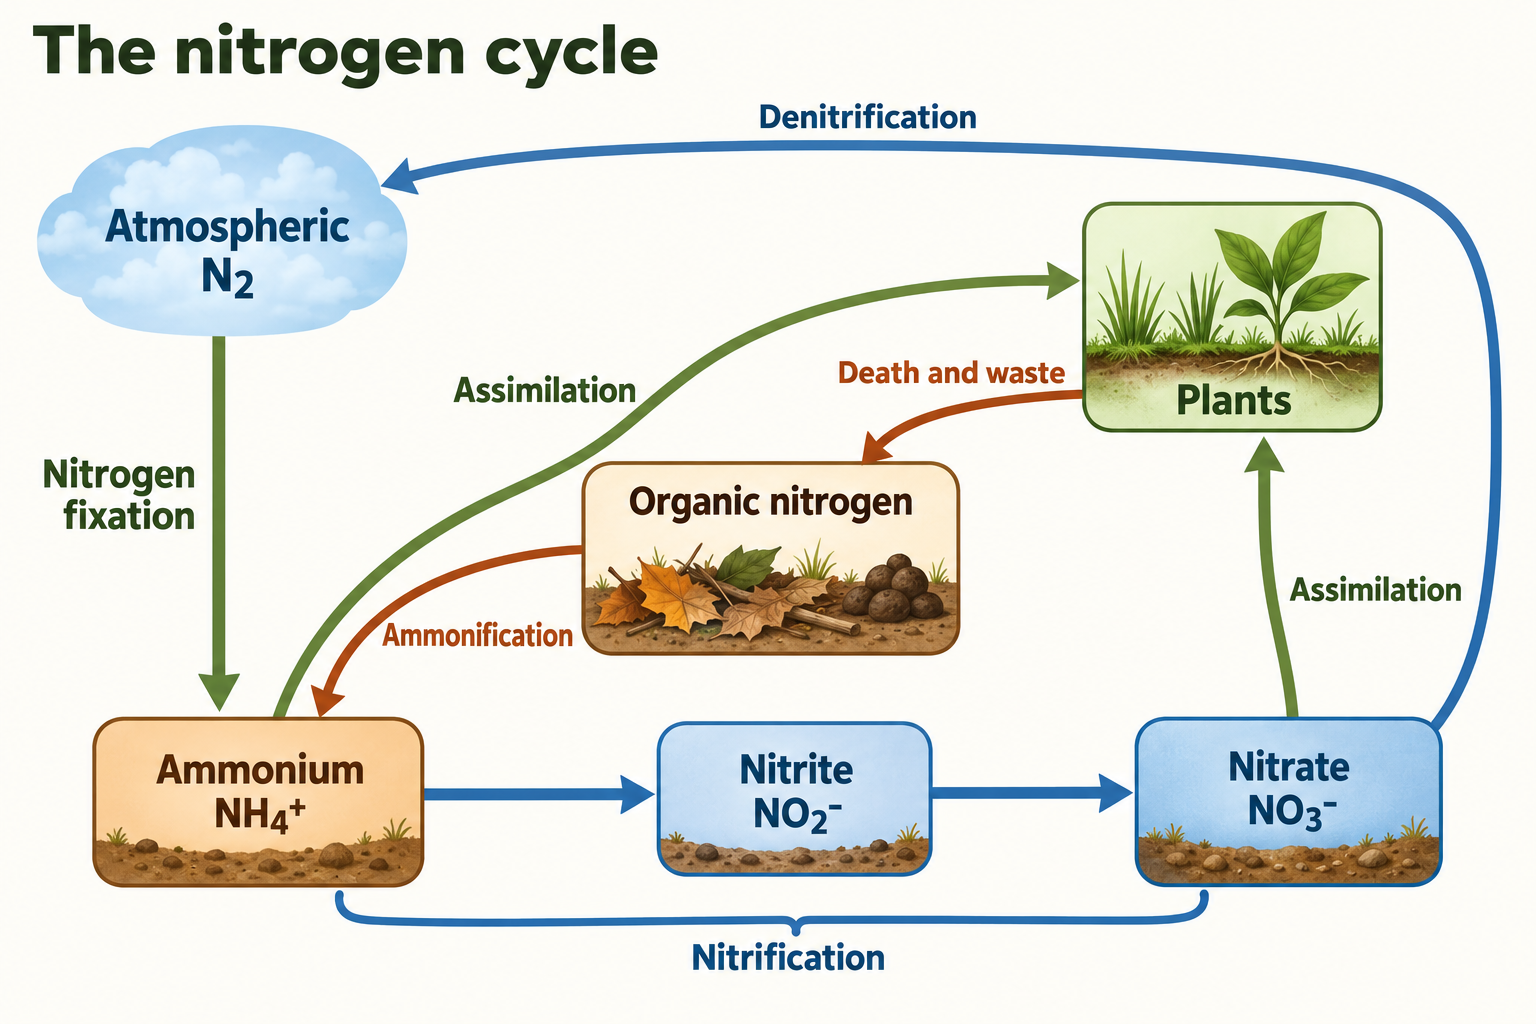
The nitrogen cycle links atmospheric N₂ with reactive nitrogen in soil, water and organisms. Nitrogen is needed in proteins, nucleic acids and ATP. Air is about 78% N₂ by volume, but most organisms cannot use it directly. Certain bacteria and archaea fix N₂; lightning and industrial fixation also produce reactive nitrogen.
Major nitrogen reservoirs: The atmosphere is the dominant readily discussed N₂ reservoir in the biological cycle. Soil organic matter, ammonium (NH₄⁺), nitrate (NO₃⁻), water and organisms hold other forms. Do not treat atmospheric abundance as direct availability to plant roots.
Key Processes in the Nitrogen Cycle
1. Nitrogen Fixation
Process: Conversion of atmospheric nitrogen gas (N₂) into ammonia (NH₃) or ammonium (NH₄⁺) that organisms can use.
Methods:
- Biological fixation: Certain bacteria and archaea use nitrogenase, requiring energy, to reduce N₂ to ammonia. Examples include Rhizobium in legume root nodules, free-living Azotobacter and some cyanobacteria. Plants provide carbon compounds to root-nodule symbionts and receive biologically usable nitrogen; the plant itself does not perform nitrogenase fixation.
- Lightning: High energy breaks N≡N bonds, producing nitrogen oxides that dissolve in rain
- Industrial Fixation (Haber-Bosch Process): Humans synthesize ammonia for fertilizers using high heat and pressure
Equation: N₂ + 8H⁺ + 8e⁻ → 2NH₃ + H₂
2. Nitrification (Two-Step Process)
Process: Bacteria convert ammonia/ammonium into nitrites (NO₂⁻), then into nitrates (NO₃⁻). Requires oxygen (aerobic process).
Step 1:Nitrosomonas bacteria oxidize ammonia to nitrite
NH₄⁺ → NO₂⁻
Step 2:Nitrobacter bacteria oxidize nitrite to nitrate
NO₂⁻ → NO₃⁻
Importance: Nitrification produces nitrate that plants can assimilate, but plants also take up ammonium. Preferences vary with species and conditions. Nitrate is mobile in water and readily leaches; nitrification does not by itself incorporate nitrogen into plant biomass. Bacteria and archaea can carry out ammonia oxidation; the named genera are examples, not the only organisms involved.
3. Assimilation
Process: Plants absorb ammonium (NH₄⁺) and nitrate (NO₃⁻) from soil through their roots and incorporate nitrogen into organic compounds (amino acids, proteins, nucleic acids).
Importance: Transfers nitrogen from inorganic to organic form. Animals obtain nitrogen by eating plants or other animals (consuming proteins).
4. Ammonification (Mineralization)
Process: Decomposers (bacteria and fungi) break down dead organisms and waste products, converting organic nitrogen back into ammonia (NH₃) or ammonium (NH₄⁺).
Importance: Returns nitrogen to soil in inorganic form so it can be reused. Connects death and decay back to the cycle.
5. Denitrification
Process: Denitrifying microbes use nitrate in oxygen-poor conditions and can return nitrogen to the atmosphere as N₂. Incomplete denitrification can release N₂O. Nitrification and denitrification have different substrates, oxygen conditions and products; they must not be treated as interchangeable steps.
Process summary (not a balanced chemical equation): NO₃⁻ → NO₂⁻ → NO → N₂O → N₂. Denitrification commonly occurs under anoxic conditions; N₂O can be an intermediate that escapes before complete conversion to N₂.
Importance: Completes the cycle by returning nitrogen to the atmosphere. Removes excess nitrate from soil and water (prevents buildup). Produces N₂O, a potent greenhouse gas.
Human Impacts on the Nitrogen Cycle
- Synthetic Fertilizers: Haber-Bosch process produces ammonia-based fertilizers, massively increasing nitrogen available to crops but causing runoff pollution
- Eutrophication: Excess nitrogen (from fertilizers, sewage) causes algal blooms in water bodies, leading to oxygen depletion (dead zones) when algae die and decompose
- Air Pollution: Combustion of fossil fuels produces nitrogen oxides (NOₓ) that contribute to smog and acid rain
- Greenhouse gas: Soil and manure nitrogen transformations can emit N₂O. Climate comparisons require a named metric and time horizon; management should match fertilizer supply to crop demand and site conditions rather than assume all applied nitrogen is emitted.
Read the equations carefully: The nitrogenase equation shown above summarizes a biological redox reaction and requires an energy input. It is not the Haber–Bosch equation, which is N₂ + 3H₂ → 2NH₃ under industrial conditions. The short NH₄⁺ → NO₂⁻ → NO₃⁻ notation is a pathway summary, not a balanced reaction with oxygen and hydrogen shown.
1.6 The Phosphorus Cycle
Overview
The phosphorus cycle moves phosphorus through rocks, soil, water and organisms. Phosphorus is part of DNA, RNA, ATP and phospholipids. It has no major gaseous reservoir comparable with atmospheric N₂ or CO₂, although phosphorus-containing dust and aerosols can travel through air. Biological recycling can be rapid, while weathering, burial and uplift operate over longer timescales.
Major phosphorus reservoirs: Phosphate-bearing rocks and sediments, soil minerals and organic matter, dissolved phosphorus in water and living biomass. Reservoir sizes depend on the boundary and timescale used; dissolved concentrations can be small yet biologically important.
Key Processes in the Phosphorus Cycle
1. Weathering
Process: Physical (wind, water, ice) and chemical (acid rain, carbonic acid) breakdown of phosphorus-containing rocks releases phosphate ions (PO₄³⁻) into soil and water.
Importance: Weathering supplies phosphorus from rock to soils and waters. Geologic replenishment is often slow relative to biological demand, but there is no one rate-limiting step for all sites or a single timescale for every weathering event. Soil binding, microbial activity and erosion also affect availability.
2. Absorption (Plant Uptake)
Process: Plants absorb dissolved phosphate ions (PO₄³⁻) from soil water through their roots and incorporate phosphorus into organic compounds (ATP, DNA, RNA, phospholipids).
Importance: Plant uptake brings dissolved inorganic phosphorus into food webs. Phosphorus can limit production, especially in strongly weathered soils and many freshwater systems, but nitrogen or combined limitations occur too. Availability relative to demand matters, not a universal ranking of nitrogen and phosphorus.
3. Consumption and Transfer Through Food Chains
Process: Animals obtain phosphorus by eating plants or other animals. Phosphorus passes through trophic levels as organisms consume each other.
Importance: Moves phosphorus through the biotic components of ecosystems. Animals excrete excess phosphorus in waste (feces, urine).
4. Decomposition
Process: When organisms die or produce waste, decomposers (bacteria and fungi) break down organic matter, releasing phosphate back into soil and water in inorganic form.
Importance: Returns phosphorus to soil where it can be reabsorbed by plants. Creates a short-term recycling loop within ecosystems.
5. Runoff and Leaching
Process: Runoff transports dissolved phosphorus and phosphorus attached to eroded soil or organic particles. Leaching can occur, but phosphate is often strongly retained by soil minerals, so its mobility differs from nitrate. Transport depends on soil chemistry, erosion, water movement and management.
Importance: Transfers phosphorus from land to aquatic ecosystems. Excess phosphorus from fertilizer runoff causes eutrophication in water bodies.
6. Sedimentation (Long-Term Storage)
Process: Phosphorus-bearing particles settle into aquatic sediments. Burial and lithification can form sedimentary rock over geologic time. Later uplift and exposure permit renewed weathering. Sedimentation, rock formation and uplift are distinct steps rather than one instantaneous conversion.
Importance: Removes phosphorus from active cycling for millions of years. Marine birds (seabirds) play a unique role by consuming fish and depositing phosphorus-rich guano (droppings) on land, returning marine phosphorus to terrestrial ecosystems.
Human Impacts on the Phosphorus Cycle
- Mining: Humans extract phosphate rock to produce fertilizers, disrupting long-term geological storage
- Agricultural Runoff: Excess phosphorus fertilizers wash into waterways, causing severe eutrophication and algal blooms
- Detergents: Phosphate-containing detergents contribute to water pollution (many now banned)
- Wastewater: Sewage and animal waste release high concentrations of phosphorus into water systems
- Limited supply: Fertilizer manufacture cannot create phosphorus atoms from air as industrial nitrogen fixation creates ammonia from N₂. Phosphate rock is finite and unevenly distributed. Recovering phosphorus from manure, wastewater and organic residues can reduce losses and demand for newly mined material.
Phosphate notation: PO₄³⁻ is convenient shorthand in cycle diagrams. In many soils and natural waters, dissolved phosphate occurs mainly as H₂PO₄⁻ and HPO₄²⁻, depending on pH. Availability is also affected by adsorption and precipitation, not just the total phosphorus present.
1.7 The Hydrologic (Water) Cycle
Overview
The hydrologic cycle (water cycle) describes the continuous movement of water through Earth's atmosphere, surface, and subsurface in its three phases: liquid, solid (ice), and gas (water vapor). The cycle is driven by solar energy and gravity. Water is essential for all life and plays a critical role in climate regulation, nutrient transport, and ecosystem function.
Major water reservoirs: Oceans hold about 97% of Earth’s water; most remaining water is freshwater stored in ice and groundwater. Lakes, rivers, soil moisture, atmospheric water and organisms hold much smaller fractions. Reservoir size differs from availability: a large frozen or deep groundwater store is not necessarily easily accessible. Use a supplied data table when calculating exact shares.
Key Processes in the Hydrologic Cycle
1. Evaporation
Process: Solar energy heats liquid water on Earth's surface (oceans, lakes, rivers, soil), causing it to change from liquid to water vapor (gas) and rise into the atmosphere.
Importance: Primary way water enters the atmosphere. Oceans are the largest source of evaporation. Rate increases with temperature, wind speed, and low humidity. Evaporation is an endothermic process (absorbs heat), which helps cool Earth's surface.
2. Transpiration
Process: Plants absorb water from soil through roots, transport it through vascular tissues, and release water vapor through stomata (tiny pores) in leaves.
Importance: Significant source of atmospheric water vapor, especially in vegetated areas. Combined with evaporation, called evapotranspiration (total water vapor entering atmosphere). Plants regulate transpiration by opening/closing stomata.
3. Sublimation
Process: Sublimation changes ice or snow directly to water vapour. It occurs when atmospheric and surface conditions favour that transfer, including cold, dry or windy settings. Low atmospheric pressure is not a requirement for sublimation.
Importance: Adds water vapor to atmosphere from glaciers, ice caps, and frozen ground. Less common than evaporation but important in polar and high-altitude regions.
4. Condensation
Process: Cooling to saturation allows water vapour to condense into liquid droplets, often on condensation nuclei such as salt or dust. Direct vapour-to-ice transfer is deposition, not condensation; freezing turns liquid droplets into ice. Clouds contain droplets, ice crystals or both. Rising air can cool by expansion, but clouds can also form through other cooling or mixing processes.
Importance: Forms clouds, which are visible accumulations of water droplets or ice crystals. Releases latent heat (exothermic), warming the atmosphere. Necessary precursor to precipitation.
5. Precipitation
Process: When water droplets or ice crystals in clouds become too heavy to remain suspended in air, they fall to Earth's surface as rain, snow, sleet, or hail.
Importance: Returns water from atmosphere to land and ocean surfaces. Replenishes freshwater sources (rivers, lakes, groundwater). Distribution of precipitation determines climate patterns and biome types.
6. Infiltration
Process: Precipitation that reaches the ground soaks into the soil through pores and cracks, moving downward under gravity.
Importance: Infiltration replenishes soil moisture. Texture influences pore size, but structure, compaction, crusting, vegetation, rainfall intensity and initial moisture also matter. Sandy soils often transmit water readily; well-structured clay soils can have large channels. Infiltration enters the soil surface; not all infiltrated water reaches groundwater.
7. Percolation and Groundwater Recharge
Process: Infiltrated water may move through the unsaturated zone, be taken up by plants, evaporate or flow laterally. The portion reaching the saturated zone contributes to groundwater recharge. The water table is the upper surface of an unconfined saturated zone. An aquifer is permeable material that stores and transmits usable quantities of groundwater; not every wet rock layer is a productive aquifer.
Importance: Groundwater supplies drinking water, irrigation and stream baseflow. Travel times vary greatly with permeability, hydraulic gradient and flow-path length, from rapid movement in some fractures to centuries or more in slow systems. Recharge, pumping and natural discharge affect water levels. Groundwater also returns to rivers, springs and oceans, providing a pathway omitted by a simple circular diagram.
8. Surface Runoff
Process: When precipitation exceeds infiltration capacity (soil is saturated or impermeable), water flows over land surface into streams, rivers, and eventually back to oceans. Water follows gravity and flows through watersheds (drainage basins).
Importance: Returns water to oceans, completing the cycle. Carries nutrients and pollutants from land to water bodies. Increased by impervious surfaces (pavement, buildings) in urban areas, leading to flooding. A watershed (drainage basin) is the land area that drains into a particular river or water body.
Human Impacts on the Hydrologic Cycle
- Deforestation: Reduces transpiration and infiltration, increases runoff and erosion
- Urbanization: Impervious surfaces (concrete, asphalt) prevent infiltration, increasing runoff and flood risk
- Agriculture: Irrigation can lower groundwater storage when extraction exceeds recharge and other inflows. It can also redistribute water and increase evaporation. Compaction may reduce infiltration; management and soil condition determine the outcome.
- Dams and Reservoirs: Alter natural water flow, increase evaporation from large surface areas
- Climate Change: Alters precipitation patterns, increases evaporation, accelerates glacier melting
💡 Exam Tip: Know the difference between infiltration (water soaking INTO soil), percolation (water moving THROUGH soil downward), and runoff (water flowing OVER land surface). Understand how human activities like urbanization and deforestation disrupt natural water cycle processes. Be able to define watershed/drainage basin!
Watershed water budgets
Compare flows over the same area and time interval. A simplified balance is change in storage = precipitation − evapotranspiration − net runoff, when other imports, exports and groundwater boundary flows are excluded. A more complete budget must include those additional terms.
Worked example: A hypothetical catchment receives 900 mm/year of precipitation, loses 500 mm/year by evapotranspiration and exports 300 mm/year as net runoff. With no other terms, storage increases by 900 − 500 − 300 = 100 mm/year. All three inputs are depths over the same catchment, so they can be compared directly.
1.8 Primary Productivity
Overview
Primary productivity is the rate at which autotrophs produce organic material using light or chemical energy. Photosynthesis supports most familiar ecosystems. Express production per area and time, such as kJ/m²/year or g C/m²/year. Grams of carbon are a mass measure, not an energy unit; specify whether a dataset measures carbon, dry biomass or energy. Productivity is a flow, whereas standing biomass is the stock present at one time.
Understanding primary productivity is crucial for the AP Environmental Science exam because it explains ecosystem carrying capacity, food web structure, and environmental limitations on life.
Gross Primary Productivity (GPP)
Gross Primary Productivity (GPP) is the total rate at which producers capture and store energy through photosynthesis in a given area over a specific time period. It represents ALL the energy fixed by photosynthesis before any is used by the producers themselves.
Key Point: GPP is analogous to a business's revenue - it's the total income before accounting for expenses (operating costs).
Net Primary Productivity (NPP)
Net primary productivity (NPP) is gross production minus producer (autotrophic) respiration. It represents new producer biomass available for growth and transfer to grazing or detrital food webs. Some biomass is eaten, some remains as standing biomass and some becomes detritus; NPP is not identical to the amount consumed by herbivores.
NPP = GPP - R
Where:
NPP = Net Primary Productivity
GPP = Gross Primary Productivity
R = Respiration (energy used by producers)
Key Point: NPP is analogous to a business's profit - it's what remains after operating expenses (respiration) are subtracted from revenue (GPP).
Example Calculation:
A forest ecosystem captures 10,000 kcal/m²/year through photosynthesis (GPP).
The trees use 6,000 kcal/m²/year for their own respiration (R).
NPP = 10,000 - 6,000 = 4,000 kcal/m²/year
This means 4,000 kcal/m²/year is available to herbivores and decomposers.
Factors Affecting Primary Productivity
Several environmental factors limit or enhance primary productivity in ecosystems:
- Sunlight: Light supplies energy for photosynthesis. Production can increase with light until another limitation or light saturation is reached; excessive light can damage photosynthetic systems. Depth, turbidity and shading affect usable light, and nutrient or water supply may prevent a proportional response.
- Water Availability: Terrestrial productivity limited by precipitation. Deserts have low NPP; tropical rainforests have high NPP.
- Temperature: Affects enzyme activity and metabolic rates. Warm temperatures generally increase productivity (within tolerance range).
- Nutrients: Nitrogen, phosphorus and other resources can limit production when their available supply is insufficient relative to biological demand. Absolute concentration alone does not identify the limiting nutrient. Addition experiments can test limitation, and organisms may be co-limited by more than one resource. Excess nutrients do not guarantee greater production if light, water or another factor is limiting.
- CO₂ concentration: Inorganic carbon is required for photosynthesis. Responses to additional CO₂ vary with plant physiology and limits imposed by water, nutrients, temperature and other conditions. CO₂ enrichment is not a guarantee of proportional growth or of no harm from climate change.
Productivity by biome: compare like with like
Terrestrial pattern: Moist tropical forests often have high NPP per unit area; deserts and tundra often have low values. Temperate forests, grasslands and boreal forests span broad ranges. Water, nutrients, temperature, disturbance and seasonality can change the ordering, so treat a simple ranking as a general pattern rather than a universal law.
Aquatic pattern: Many estuaries, marshes, reefs and productive coastal systems have high production per unit area. Nutrient-limited open-ocean regions can be low per unit area, yet the ocean’s enormous area makes its total production important. Reef gross production can be high while respiration is also high; compare the same quantity (GPP or NPP), area basis and time interval before ranking ecosystems.
Worked productivity comparisons
Example 1: If GPP is 2,400 g C/m²/year and producer respiration is 1,500 g C/m²/year, NPP = 900 g C/m²/year. The fraction retained as NPP is 900 ÷ 2,400 × 100 = 37.5%. This value follows from the supplied data, not a fixed biological constant.
Example 2: A small wetland produces 1,800 g C/m²/year over 2,000 m²: total NPP = 3,600,000 g C/year. A larger grassland produces 600 g C/m²/year over 10,000 m²: total NPP = 6,000,000 g C/year. The wetland has greater production per area, while the grassland has greater total production in this example.
1.9 Trophic Levels
Overview
Trophic levels describe feeding positions relative to producers, not relative to the Sun as a numbered level. Producers occupy level 1; each consumer step adds a level in a simple chain. Organisms can feed at more than one level in a food web, so trophic position depends on the diet and pathway being considered.
The word "trophic" comes from the Greek word trophos, meaning "feeding" or "nourishment."
Producer and consumer levels
1st Trophic Level: Producers (Autotrophs)
Definition: Organisms that produce their own food using energy from sunlight (photosynthesis) or chemical reactions (chemosynthesis).
Examples: Plants, algae, phytoplankton, photosynthetic bacteria, cyanobacteria
Role: Producers introduce organic material into food webs using light or inorganic chemical energy. Photoautotrophs dominate many ecosystems; chemosynthetic autotrophs support some dark environments. The producer level is the biological base, while sunlight is an energy input rather than an organism or trophic level.
2nd Trophic Level: Primary Consumers (Herbivores)
Definition: Organisms that eat producers (plants). They are the first level of heterotrophs (organisms that cannot make their own food).
Examples: Grasshoppers, deer, rabbits, caterpillars, zooplankton, cows, elephants
Role: Transfer energy from producers to higher trophic levels. Convert plant biomass into animal biomass.
3rd Trophic Level: Secondary Consumers (Carnivores)
Definition: Organisms that eat primary consumers (herbivores). First level of carnivores.
Examples: A frog eating herbivorous insects is a secondary consumer; a small fish eating herbivorous zooplankton can occupy the same level. Foxes eating rabbits and snakes eating herbivorous mice are other examples. The animal’s identity alone does not fix its level; inspect the food source.
Role: Control herbivore populations. Continue energy transfer up the food chain.
4th Trophic Level: Tertiary Consumers
Definition: Organisms that eat secondary consumers. Often apex predators with no natural predators.
Examples: A hawk eating a snake that ate a herbivorous mouse is a tertiary consumer in that chain. A lion eating a grazing antelope is instead a secondary consumer. Large size and being an apex predator do not automatically mean a fourth-level feeding position.
Role: Tertiary consumers can influence populations at lower levels and receive less transferred production than the levels beneath them in the stated chain. They are not always apex predators: a quaternary consumer may feed on them. Apex status and numbered trophic position are different descriptions.
Special Category: Decomposers and Detritivores
Decomposers: Bacteria and fungi that chemically break down dead organic matter and waste at the molecular level, releasing nutrients back to soil.
Detritivores: Animals such as earthworms, millipedes and dung beetles consume detritus. Vultures are more specifically scavengers that consume animal carcasses. Decomposers, detritivores and scavengers all contribute to breakdown and food-web transfer, but they are not identical feeding mechanisms.
Role: Essential for nutrient cycling. Operate at all trophic levels by breaking down dead organisms and waste from every level, returning nutrients to producers.
5th trophic level: quaternary consumers
In the illustrative chain grass → grasshopper → frog → snake → hawk, the hawk occupies level 5 and is a quaternary consumer. Not every web contains the same number of levels, and a hawk with a different diet can occupy another position. A snake eating a frog is tertiary in this particular chain.
Omnivory: A mouse eating seeds acts as a primary consumer, while the same mouse eating herbivorous insects acts as a secondary consumer. Decomposers receive organic matter from multiple levels rather than forming one mandatory final numbered step.
1.10 Energy Flow and the 10% Rule
Overview
Energy flows through ecosystems from an external supply, usually sunlight, into producers and through grazing and detrital pathways. It is ultimately dispersed as heat. Matter is recycled, but energy is not recycled into a fresh supply usable by producers. Decomposers obtain organic material from every trophic level; they are not simply the final step after the top predator.
The 10% Rule is one of the most important concepts in AP Environmental Science for understanding energy transfer between trophic levels.
The 10% Rule Explained
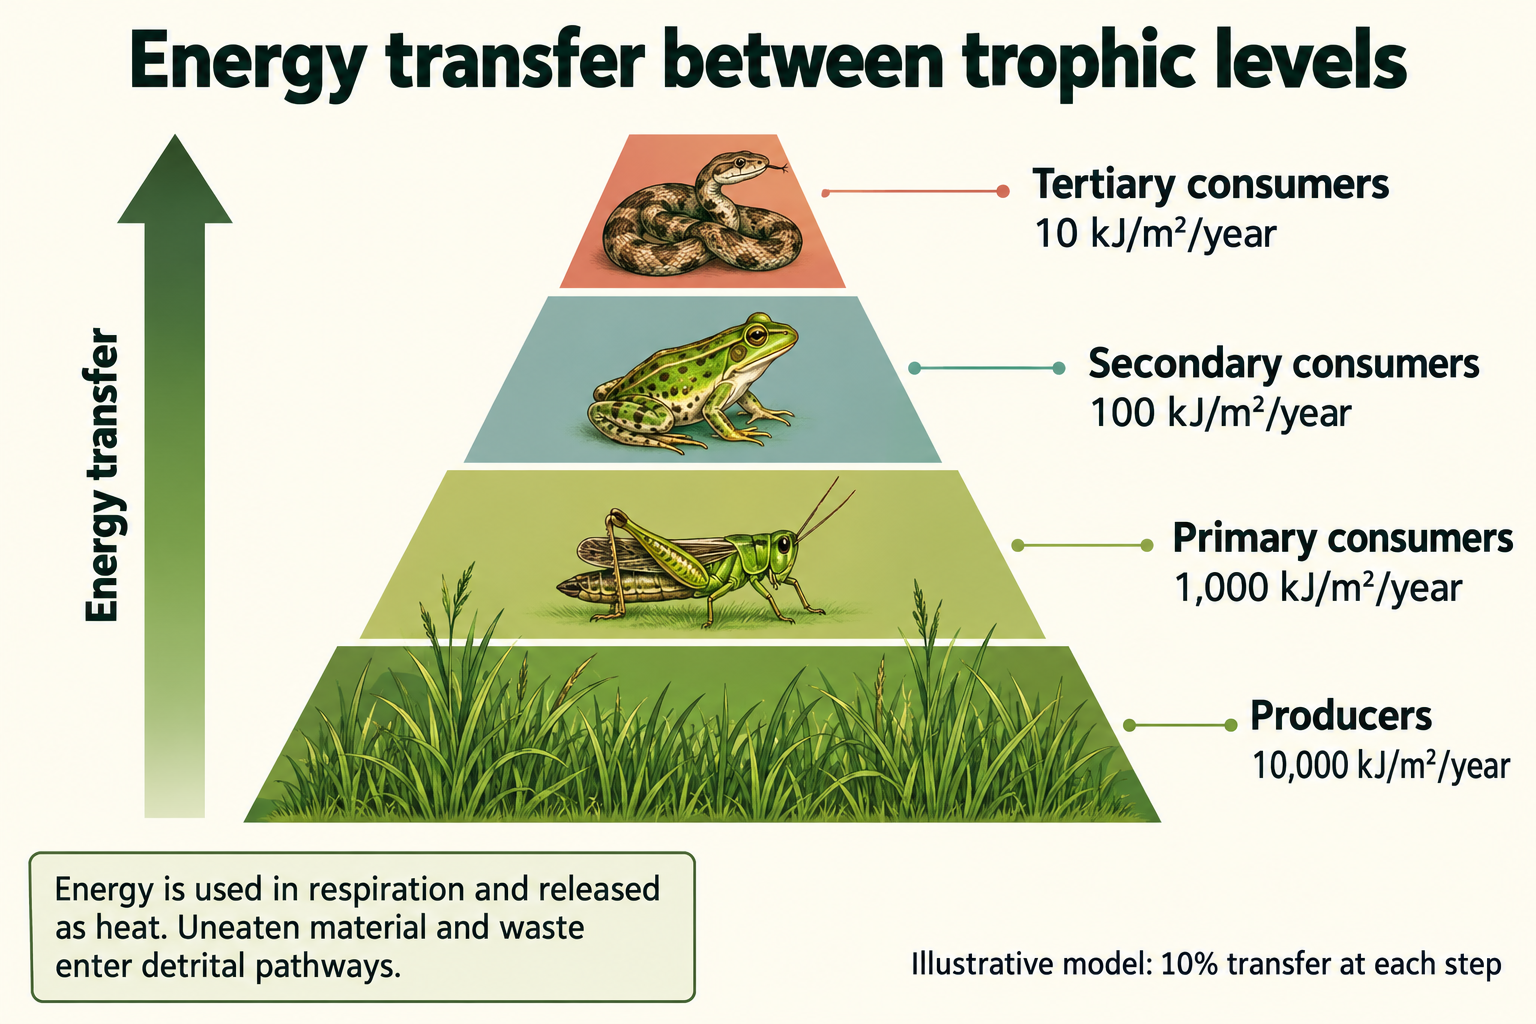
The 10% rule is an approximate model: about 10% of production at one trophic level becomes production at the next. Actual transfer efficiencies vary. The portion not transferred to the next grazing level includes respiratory heat, uneaten material and unassimilated waste. Some organic energy enters the detrital web before eventually dissipating as heat.
This means if producers have 10,000 kcal of energy, primary consumers receive only ~1,000 kcal, secondary consumers receive ~100 kcal, and tertiary consumers receive ~10 kcal.
Why is energy transfer inefficient?
- Cellular respiration: Organisms use organic chemical energy to make ATP and power maintenance, movement and other activities. Much of that energy becomes heat. Growth and reproduction retain some energy in new biomass—the production that can become food for another level—so they must not all be counted as immediate respiratory loss.
- Incomplete Consumption: Not all organisms at a lower level are eaten. Many die and are decomposed instead.
- Incomplete digestion: Some ingested material is not assimilated and leaves as feces (egestion). Excretion removes metabolic wastes. Both waste streams can feed detrital processes, but egestion and excretion are different terms.
- Thermodynamics: Energy is conserved (first law), while transformations disperse some energy as heat and increase total entropy (second law). Energy described as “lost” from a food chain is not destroyed; it is unavailable for the next specified feeding transfer. Nutrients can be recycled even as usable energy dissipates.
Example Calculation: Energy Flow Through Trophic Levels
Illustrative model: Begin with 100,000 kcal of producer production over a specified area and time—not 100,000 kcal of incoming sunlight. Assume exactly 10% transfer at every feeding step for this exercise:
- Producers (grass): 100,000 kcal stored as biomass
- Primary consumers (grasshoppers): 10,000 kcal (10% of 100,000)
- Secondary consumers (frogs): 1,000 kcal (10% of 10,000)
- Tertiary consumers (snakes): 100 kcal (10% of 1,000)
- Quaternary consumers (hawks): 10 kcal (10% of 100)
Notice: In this assumed 10%-transfer example, 90% of one level’s production does not become production at the next feeding level. This is not a claim that all of it immediately becomes heat; some enters detrital pathways.
Consequences of the 10% Rule
- Limited Food Chain Length: Most food chains have only 4-5 trophic levels because insufficient energy reaches higher levels to support viable populations.
- Biomass pyramids: Standing biomass often decreases upward in terrestrial webs, but aquatic biomass pyramids can be inverted when producers have rapid turnover. A biomass stock measured at one instant differs from production over time.
- Energy Pyramids: Total energy available decreases at each trophic level, always forming a true pyramid (never inverted).
- Population sizes: Energy limits consumer production, but the number of organisms also depends on their size and turnover. A single large producer can support many small consumers. Number pyramids therefore need not match the energy pyramid.
- Human food production: Eating producers directly can avoid an additional trophic transfer and often uses less feed energy than eating animals raised on crops. Feed conversion varies by species, system and metric. Do not equate a biomass ratio in kilograms with a universal energy-transfer efficiency; grazing animals may also consume material people cannot eat directly.
Worked transfer and efficiency problems
Two transfers: If producer production is 20,000 kJ/m²/year and efficiency is 10% at each step, secondary-consumer production is 20,000 × 0.10² = 200 kJ/m²/year. Producers → primary consumers → secondary consumers is two transfers, not three.
A supplied efficiency: If herbivore production is 800 kJ/m²/year and the next consumer level produces 120 kJ/m²/year, efficiency = 120 ÷ 800 × 100 = 15%. Use 15% for that measured transfer rather than forcing the answer to match the approximate 10% rule.
1.11 Food Chains and Food Webs
Food Chains
A food chain is a linear sequence showing how energy and matter flow from one organism to another through feeding relationships. Each step in a food chain represents a trophic level. Food chains show a simplified, single pathway of energy transfer.
Example Terrestrial Food Chain:
Sun → Grass → Grasshopper → Frog → Snake → Hawk
(Producer → Primary Consumer → Secondary Consumer → Tertiary Consumer → Quaternary Consumer)
Example Aquatic Food Chain:
Sun → Phytoplankton → Zooplankton → Small Fish → Large Fish → Shark
(Producer → Primary Consumer → Secondary Consumer → Tertiary Consumer → Quaternary Consumer)
Key Characteristics of Food Chains:
- Linear and simplified representation
- Always begin with a producer (autotroph)
- Arrows show direction of energy flow (what eats what)
- Typically limited to 4-5 levels due to energy loss
Food Webs
A food web models multiple connected feeding pathways in an ecosystem. It is more realistic than one chain, but a diagram is still a model: it may omit species, interactions or changes through time. Omnivory and multiple prey options mean an organism may participate in several chains and trophic positions.
Why Food Webs are Important:
- Show Complexity: Reveal intricate feeding relationships and energy pathways
- Demonstrate Interconnections: Show how species depend on multiple food sources
- Explain resilience: Alternative prey can sometimes buffer a consumer against loss of one food source. More links do not automatically make every ecosystem more stable; interaction strengths, food quality and the species affected matter. Follow the stated relationships rather than assume every species can substitute for another.
- Predict Impacts: Help predict consequences of removing or adding species
Example of Food Web Complexity:
In a forest ecosystem, a hawk doesn't just eat snakes:
Hawk eats: snakes, mice, rabbits, small birds
Rabbit eats: grass, clover, tree bark
Mouse eats: seeds, insects, grass
Snake eats: mice, frogs, birds
All these organisms are connected in multiple overlapping food chains that form a food web!
Types of Food Chains
Grazing Food Chain
Definition: Begins with living plants (producers) being eaten by herbivores.
Example: Grass → Deer → Wolf
Characteristic: A grazing pathway begins with living producer tissue. In photosynthetic systems, the input is sunlight; chemosynthetic producer-based pathways are also possible. Many ecosystems route substantial production into detritus, so the grazing pathway is not universally dominant.
Detrital Food Chain (Decomposer Food Chain)
Definition: Begins with dead organic matter (detritus) being consumed by decomposers and detritivores.
Example: Dead leaves → Earthworms → Beetles → Birds
Characteristic: A detrital pathway begins with dead organic material rather than living producer tissue. It is important in forest floors and aquatic sediments. It may be less directly tied to current local sunlight, but much of its organic energy originally came from photosynthesis elsewhere or earlier. Decomposers recycle nutrients while organic energy eventually dissipates as heat.
⚠️ Common Pitfall: In food chains and webs, arrows point in the direction of ENERGY FLOW (from food source to consumer), NOT the direction of "who eats who." So "Grass → Rabbit" means energy flows from grass to rabbit (rabbit eats grass). Never draw arrows backward!
Predicting a food-web response
Worked reasoning: In a stated web, frogs eat grasshoppers and snakes eat frogs. If frog abundance falls, grasshopper grazing may increase and food available to snakes may decrease. Those are conditional predictions: alternative prey, disease, habitat and density-dependent responses can alter the outcome. A food-web arrow identifies a feeding pathway, not a guarantee of the size of every population response.
Reading checklist: Start at the food source and follow the arrow to its consumer. Count the producer as level 1, identify any omnivores, and distinguish a direct effect from an indirect cascade. The Sun is an external energy input; it is not a producer organism.
Unit 1 Key Takeaways for AP Exam Success
Must-Know Concepts
- Biotic vs. abiotic factors
- Biome characteristics (temp + precip)
- Aquatic zone classification
- All biogeochemical cycle steps
- NPP = GPP - R equation
- 10% Rule calculations
- Trophic level definitions
Common Mistakes to Avoid
- Confusing GPP and NPP
- Drawing food chain arrows backward
- Mixing up cycle processes and bacteria
- Forgetting that phosphorus lacks a major gaseous reservoir, while dust can still transport it
- Confusing infiltration and percolation
- Wrong trophic level numbering
- Misapplying the 10% Rule
Study Strategies
Practice drawing all four biogeochemical cycles from memory. Create flashcards for biome characteristics. Work through multiple 10% Rule problems. Use mnemonic devices for nitrogen cycle bacteria (e.g., "Nitrifying Nitrosomonas and Nitrobacter"). Compare food chains to food webs in diagrams.
APES Unit 1 study notes FAQs
What topics are covered in APES Unit 1 study notes?
These detailed notes cover all 11 Unit 1 topics: ecosystem interactions, terrestrial and aquatic biomes, carbon, nitrogen, phosphorus and water cycles, primary productivity, trophic levels, energy flow, the 10% rule, food chains and food webs. Worked examples explain productivity, water budgets and energy-transfer calculations.
How much of the AP Environmental Science multiple-choice section is Unit 1?
College Board assigns Unit 1: The Living World: Ecosystems a 6–8% weighting in the multiple-choice section. Use that range to guide revision rather than predict an exact question count. These are independent NUM8ERS study materials.
What is the difference between GPP and NPP?
Gross primary productivity is total primary production before producer respiration. Net primary productivity equals GPP minus producer respiration. Use matching units and do not subtract all consumer and decomposer respiration when calculating NPP.
Is the 10% rule always exact?
No. It is an approximate model of transfer between trophic production levels. Apply a supplied efficiency when one is given. Count feeding steps from the producer level, and distinguish energy flow over time from standing biomass or organism counts.
Which biogeochemical cycle lacks a major gaseous reservoir?
Among the four cycles covered here, phosphorus lacks a major gaseous reservoir. Phosphorus can still travel through air in dust and aerosols. Its biological recycling can be rapid even though geological supply and storage often operate more slowly.
How should I revise APES Unit 1?
Use the contents menu to review one topic at a time. Explain each process, redraw cycle arrows and practise calculations with units. Then use the Unit 1 flashcards for recall and the Unit 1 quiz to check application and reasoning.