
Independent educational guide
Early Solutions to the 2026 AP Macroeconomics FRQs | Step by Step
Complete reasoning, calculations, graph construction, model responses, exam-ready answers, and common-error checks for all three free-response questions in the uploaded solution guide.
How to Use This Guide
For every explanation, write a complete causal chain. For every graph, label both axes, every required curve, the initial equilibrium, the shift, and the new directional result. For every calculation, show the formula, substitution, arithmetic, direction, and units.
The uploaded exam gives one hour for three questions and recommends about 25 minutes for Question 1 and about 12 minutes each for Questions 2 and 3 after planning. This guide is deliberately more detailed than an exam response so that you can see every link in the reasoning.
| Task word | What an AP-ready response must do |
|---|---|
| Identify | State the correct item or direction directly. Do not bury the answer. |
| Calculate | Write the equation, substitute the numbers, show the arithmetic, and include the unit or direction. |
| Draw | Use the exact market or model requested, label axes and curves, and show the shift and resulting equilibrium change. |
| Explain | State the result and connect it to the final outcome through at least one valid economic mechanism. |
Meaning of "based solely": Hold every other determinant constant.
One-Page Answer Map
| Part | Answer | Core reason |
|---|---|---|
| 1B | SRAS shifts left; output falls to \(Y_F\). | An inflationary gap raises nominal wages and input prices. |
| 1C(i) | Sell government securities. | This is a contractionary open-market operation in a limited-reserve system. |
| 1D | Inflows increase; bond prices decrease; investment decreases. | The nominal interest rate rises. |
| 1E | Unemployment increases. | Lower investment reduces AD, output, and employment. |
| 2A-B | 14.1 million employed; 6% unemployment. | Labor force equals employed plus unemployed. |
| 2C | Point X at 6% unemployment and 2% inflation; LRPC at 3%. | Actual unemployment exceeds the natural rate. |
| 2D | The unemployment rate increases. | Retirees leave the labor force, so the denominator falls. |
| 3A(i) | Lower interest on reserves or another administered rate. | This is expansionary policy in an ample-reserve system. |
| 3A(ii) | Increase \(G\) by 150 million crowns. | The government-spending multiplier is 4. |
| 3B | The price level increases. | Higher \(G\) shifts AD right. |
| 3C | LIZ depreciates. | Higher Lizland prices reduce foreign demand for LIZ. |
Micanapy: Inflationary Gap and Contractionary Monetary Policy
This question connects AD-AS, long-run self-adjustment, the money market, capital flows, bond prices, investment, and unemployment.
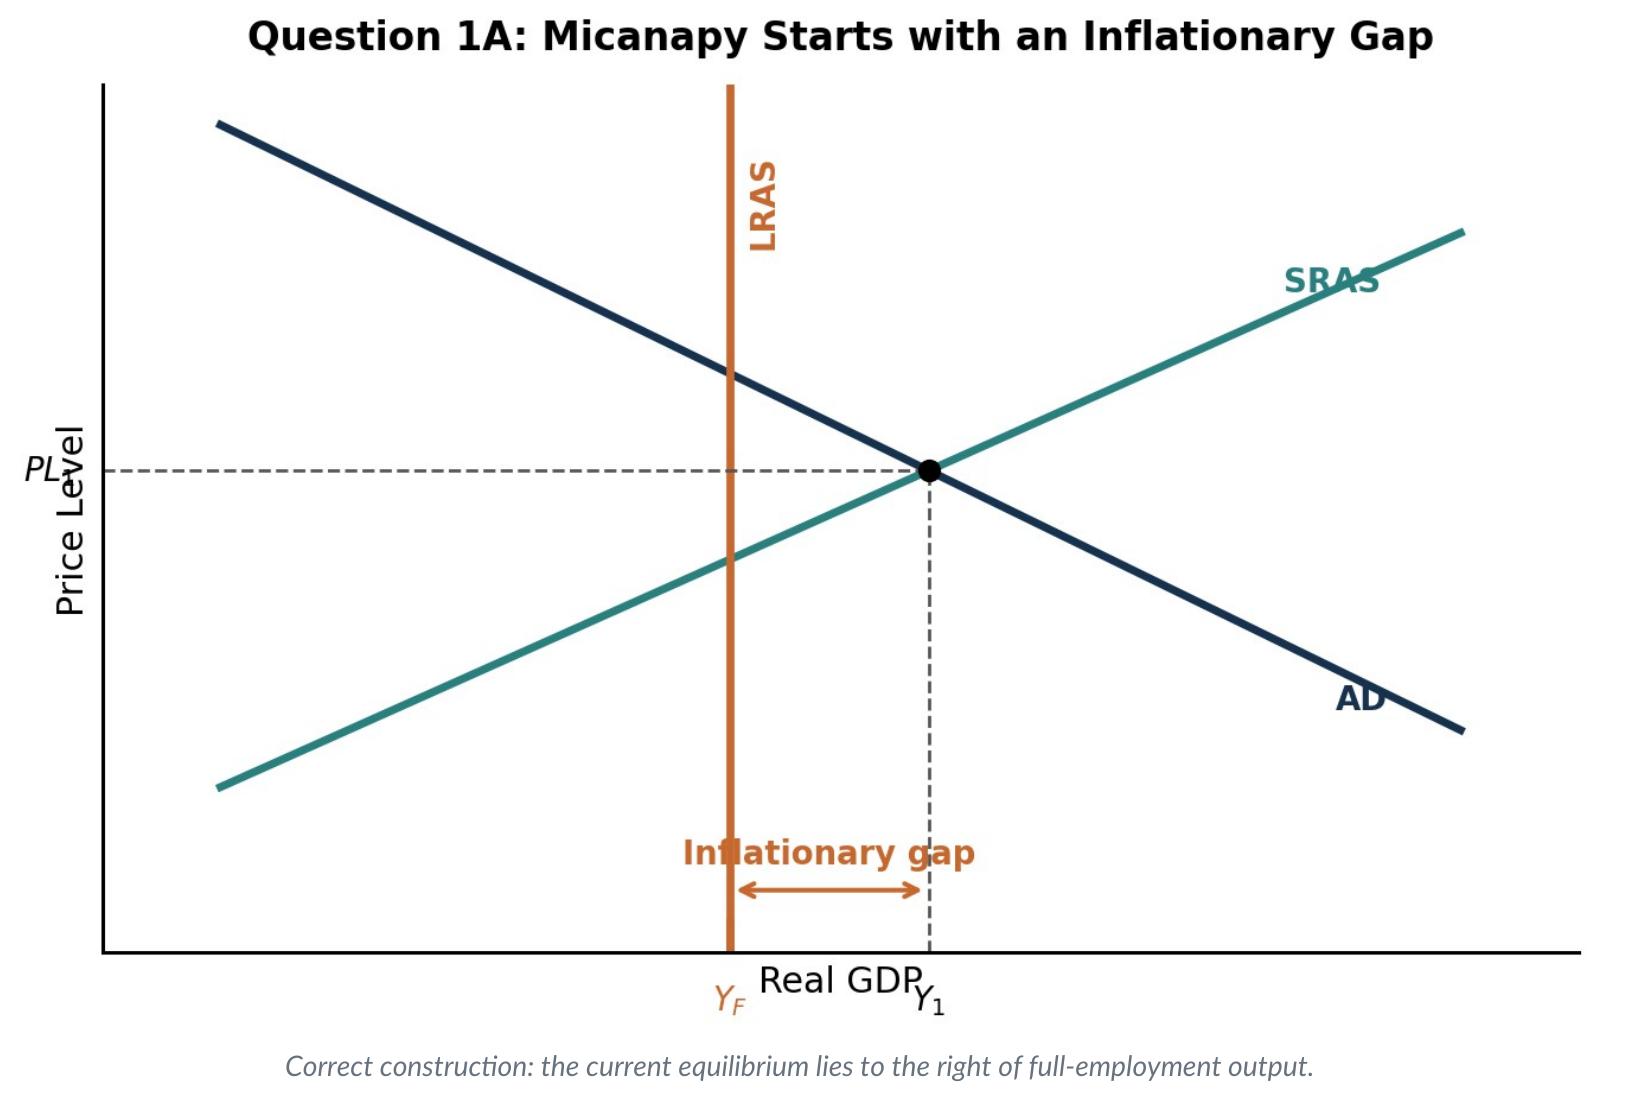
Part A: Draw the Initial AD-AS Graph
- Label the axes. Put Price Level on the vertical axis and Real GDP on the horizontal axis.
- Draw the three curves. Draw AD downward sloping, SRAS upward sloping, and LRAS vertical.
- Place the current equilibrium. The intersection of AD and SRAS is the short-run equilibrium. Label its output \(Y_1\) and its price level \(PL_1\).
- Show the inflationary gap. Put LRAS at \(Y_F\) to the left of \(Y_1\). The horizontal distance \(Y_1-Y_F\) is the positive output gap.
Part B: Explain the Long-Run Self-Adjustment
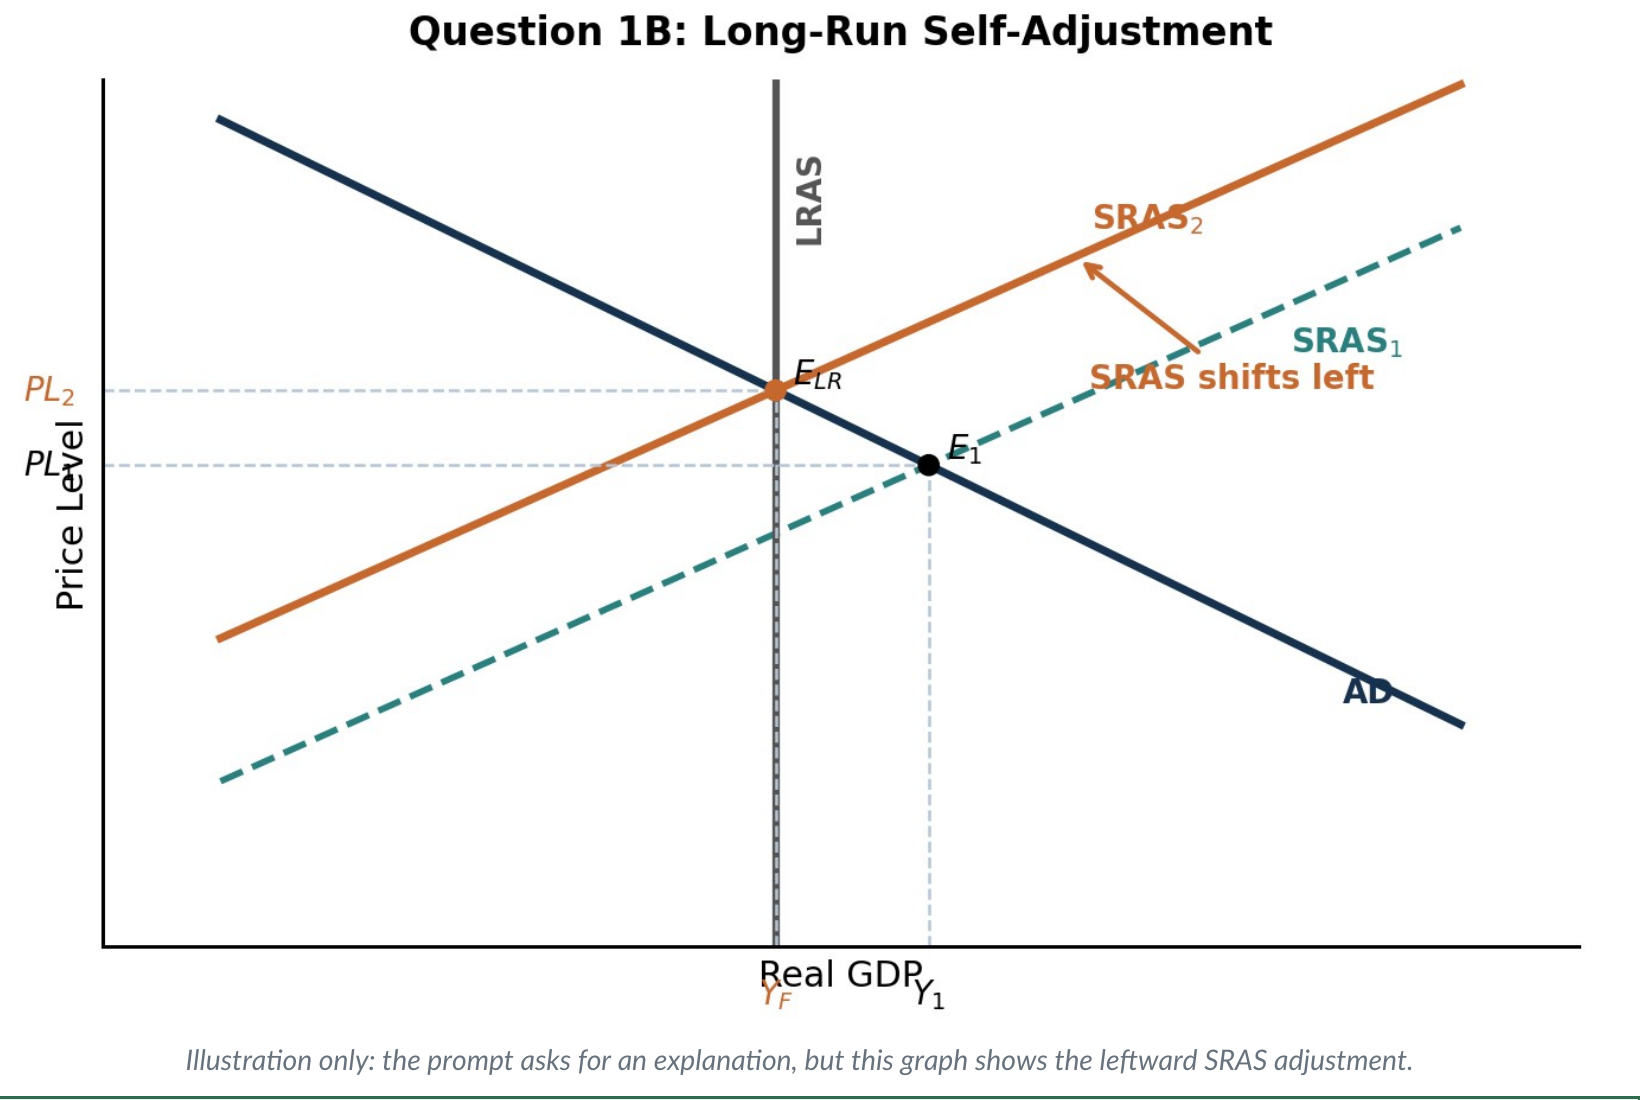
No policy action: rising input costs shift SRAS left until the gap closes.
- Start with the labor market. Output above \(Y_F\) means firms are using labor and other resources beyond their normal full-employment level. Actual unemployment is below the natural rate.
- Identify the cost pressure. A tight labor market gives workers greater bargaining power. Nominal wages and other input prices rise; inflationary expectations may also rise.
- Shift the correct curve. Higher per-unit production costs decrease short-run aggregate supply, shifting SRAS left. AD and LRAS do not shift in the self-correction story.
- State the new long-run outcome. Real output falls from \(Y_1\) to \(Y_F\), while the price level rises. The economy ends where AD, the new SRAS, and LRAS intersect.
Part C: Contractionary Monetary Policy in a Limited-Reserve System
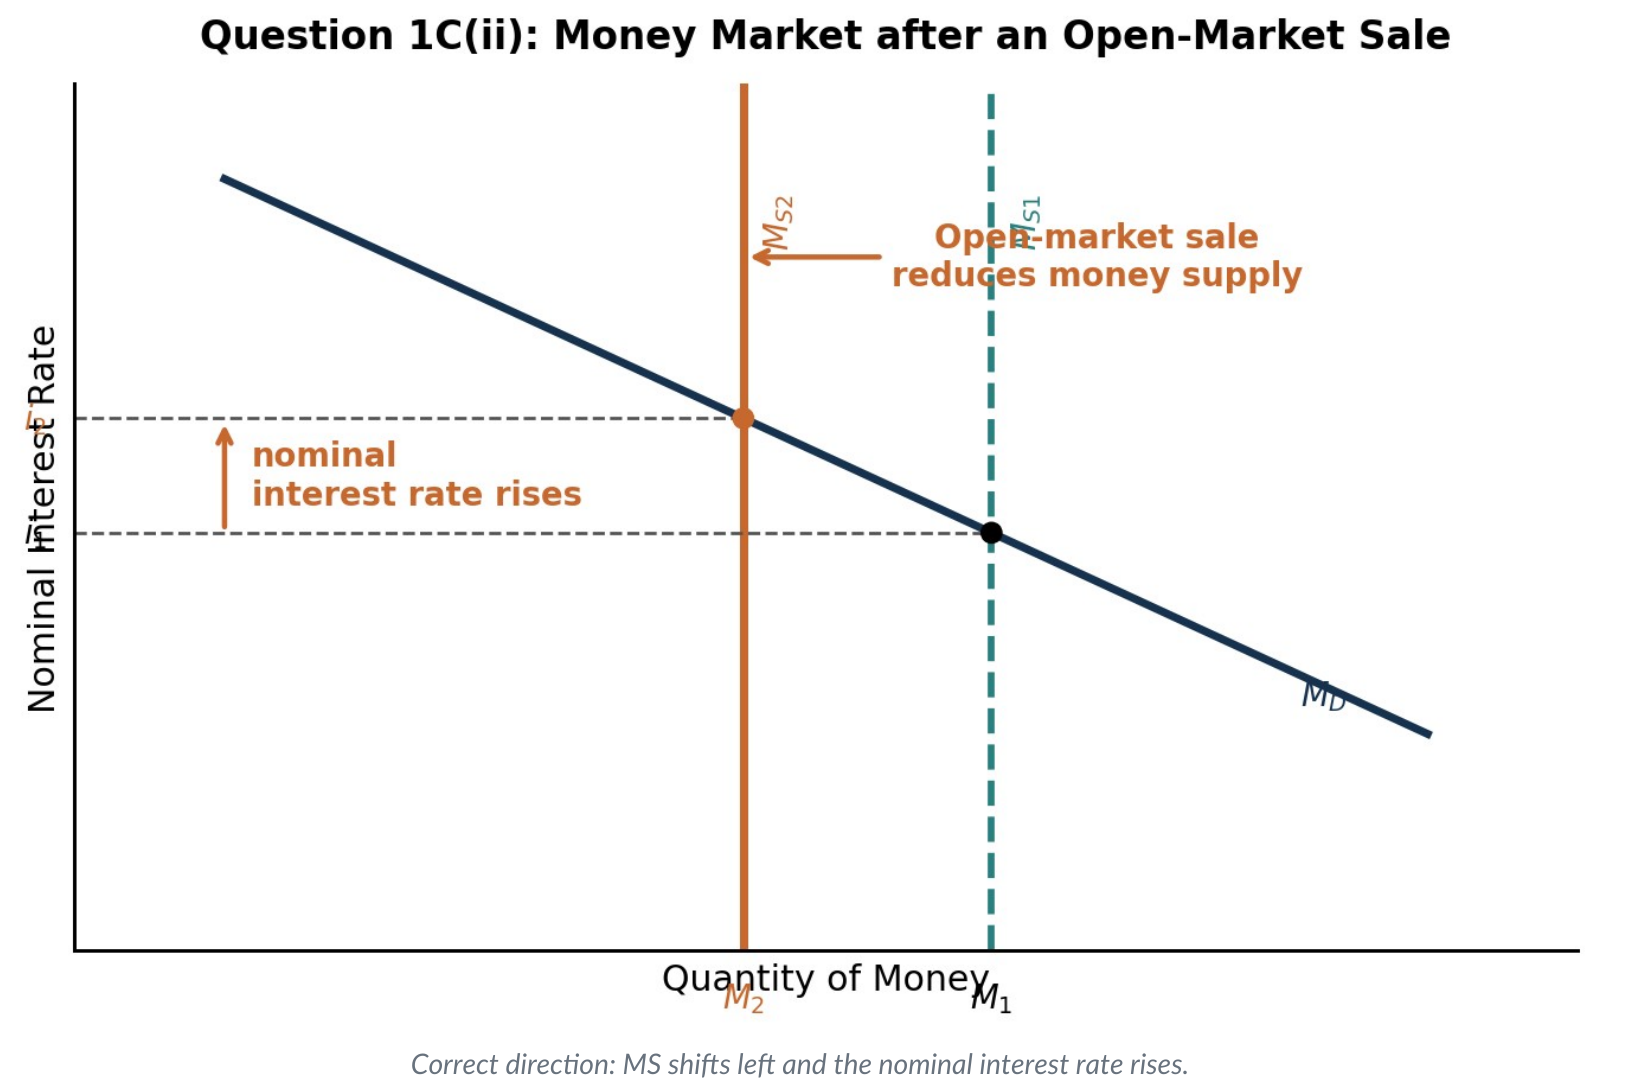
Open-market sale → lower money supply → higher nominal interest rate.
Part C(i): Identify the Open-Market Operation
The central bank should sell government securities in the open market. The sale removes reserves from banks and decreases the money supply. Because the banking system has limited reserves, this reduction in the money supply raises the equilibrium nominal interest rate.
Part C(ii): Show the Effect in the Money Market
- Use the requested market. Put the nominal interest rate on the vertical axis and quantity of money on the horizontal axis. Draw a downward-sloping money-demand curve and a vertical money-supply curve.
- Shift money supply. An open-market sale decreases bank reserves and the money supply, so MS shifts left from \(MS_1\) to \(MS_2\).
- Label the rate change. At the unchanged money-demand curve, the nominal interest rate rises from \(i_1\) to \(i_2\).
Part D: Follow the Higher Interest Rate Through the Economy
| Variable | Change | Reasoning |
|---|---|---|
| International financial capital flows into Micanapy | Increase | Higher domestic interest rates raise the return on Micanapy financial assets relative to foreign assets, attracting international investors. |
| Price of previously issued bonds | Decrease | Old bonds have fixed coupon payments. When market interest rates rise, their prices must fall so their yields become competitive with newly issued bonds. |
| Private domestic investment spending | Decrease | The cost of borrowing and the opportunity cost of using internal funds rise, so fewer planned investment projects are profitable. |
Part E: Use the Investment Change to Determine Unemployment
The unemployment rate increases. Lower investment reduces aggregate demand. In the short run, firms respond to weaker sales by producing less and employing fewer workers, so cyclical unemployment rises. Because Micanapy begins with unemployment below the natural rate, the contraction moves unemployment upward toward the natural rate.
Question 1 self-check
- \(Y_1\) is to the right of \(Y_F\) on the first AD-AS graph.
- Self-adjustment uses rising nominal wages and input prices and a leftward SRAS shift.
- The open-market operation is a sale, not a purchase.
- The money-supply curve shifts left and the nominal interest rate rises.
- Capital inflows rise; old bond prices and investment fall.
- Lower investment increases unemployment in the short run.
Foxhound: Labor Statistics and the Phillips Curve
Classify the population correctly, calculate employment and unemployment, and place the numerical values on the Phillips curve graph.
Part A: Calculate the Number Employed
The 200,000 retirees and the 100,000 people not working and not looking are not subtracted again because neither group is included in the stated labor force.
Part B: Calculate the Actual Unemployment Rate
Part C: Construct the Phillips Curve Graph
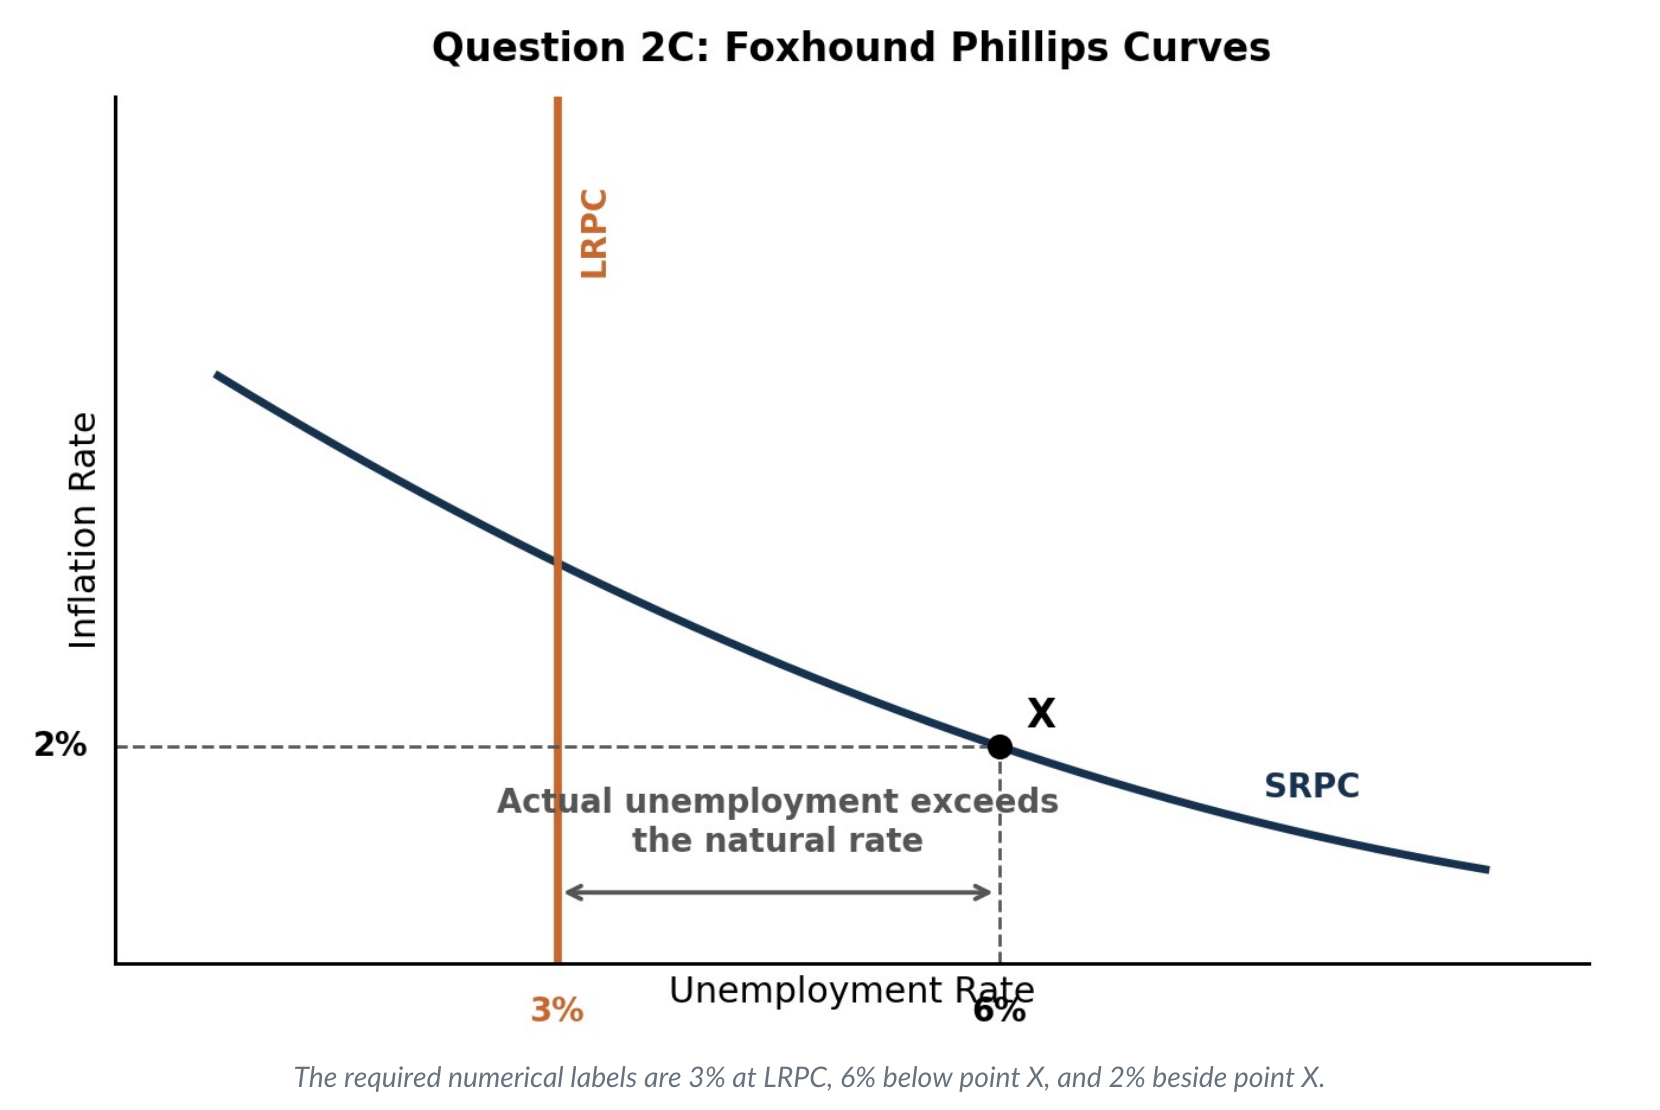
LRPC at 3%; short-run equilibrium X at 6% unemployment and 2% inflation.
- Label the axes. Put the inflation rate on the vertical axis and the unemployment rate on the horizontal axis.
- Draw SRPC. Draw a downward-sloping short-run Phillips curve.
- Draw LRPC. Draw a vertical long-run Phillips curve at the natural rate of unemployment, 3%.
- Place point X. Plot X on the SRPC at 6% unemployment and 2% inflation. Since 6% is greater than 3%, X must be to the right of the LRPC.
Part D: What Happens When Employed Workers Retire?
Let \(R\) be the number of employed workers who retire. When they retire, they are no longer employed and they also leave the labor force. The number unemployed remains 900,000.
Because \(15{,}000{,}000-R\) is smaller than 15,000,000, the fraction is larger than 6%. Therefore, the unemployment rate increases.
Question 2 common mistakes
- Adding retirees or people not looking for work to the unemployed count.
- Using the total population instead of the labor force as the denominator.
- Putting the LRPC at 6% instead of the natural rate of 3%.
- Placing X to the left of the LRPC even though actual unemployment is greater than the natural rate.
- Saying retirement leaves the unemployment rate unchanged because retirees are not unemployed; this ignores the smaller labor-force denominator.
Lizland: Recessionary Gap, Policy, Multiplier, and Exchange Rate
This question links ample-reserve monetary policy, expansionary fiscal policy, the price level, and depreciation of the Lizland crown.
Part A(i): Choose the Correct Ample-Reserve Monetary Policy Action
| Banking system | AP policy tool |
|---|---|
| Limited reserves | Change the money supply through open-market operations. |
| Ample reserves | Change administered interest rates, especially the interest rate paid on reserve balances. |
To close a recessionary gap, the central bank should decrease its administered interest rates, such as the interest rate paid on reserve balances. This lowers the policy rate, stimulates interest-sensitive consumption and investment, and increases aggregate demand.
Part A(ii): Calculate the Minimum Change in Government Spending
Use the government-spending multiplier and preserve the sign and direction.
- Find the marginal propensity to save. \(MPS=1-MPC=1-0.75=0.25\).
- Find the government-spending multiplier. \(k_G=1/MPS=1/0.25=4\).
- Solve for the required change in \(G\). \(\Delta\text{Real GDP}=k_G\times\Delta G\). Therefore, \(600\text{ million}=4\times\Delta G\).
- State the sign and unit. \(\Delta G=150\) million crowns. Because the gap is recessionary, government spending must increase.
Part B: Effect of the Fiscal Expansion on the Price Level
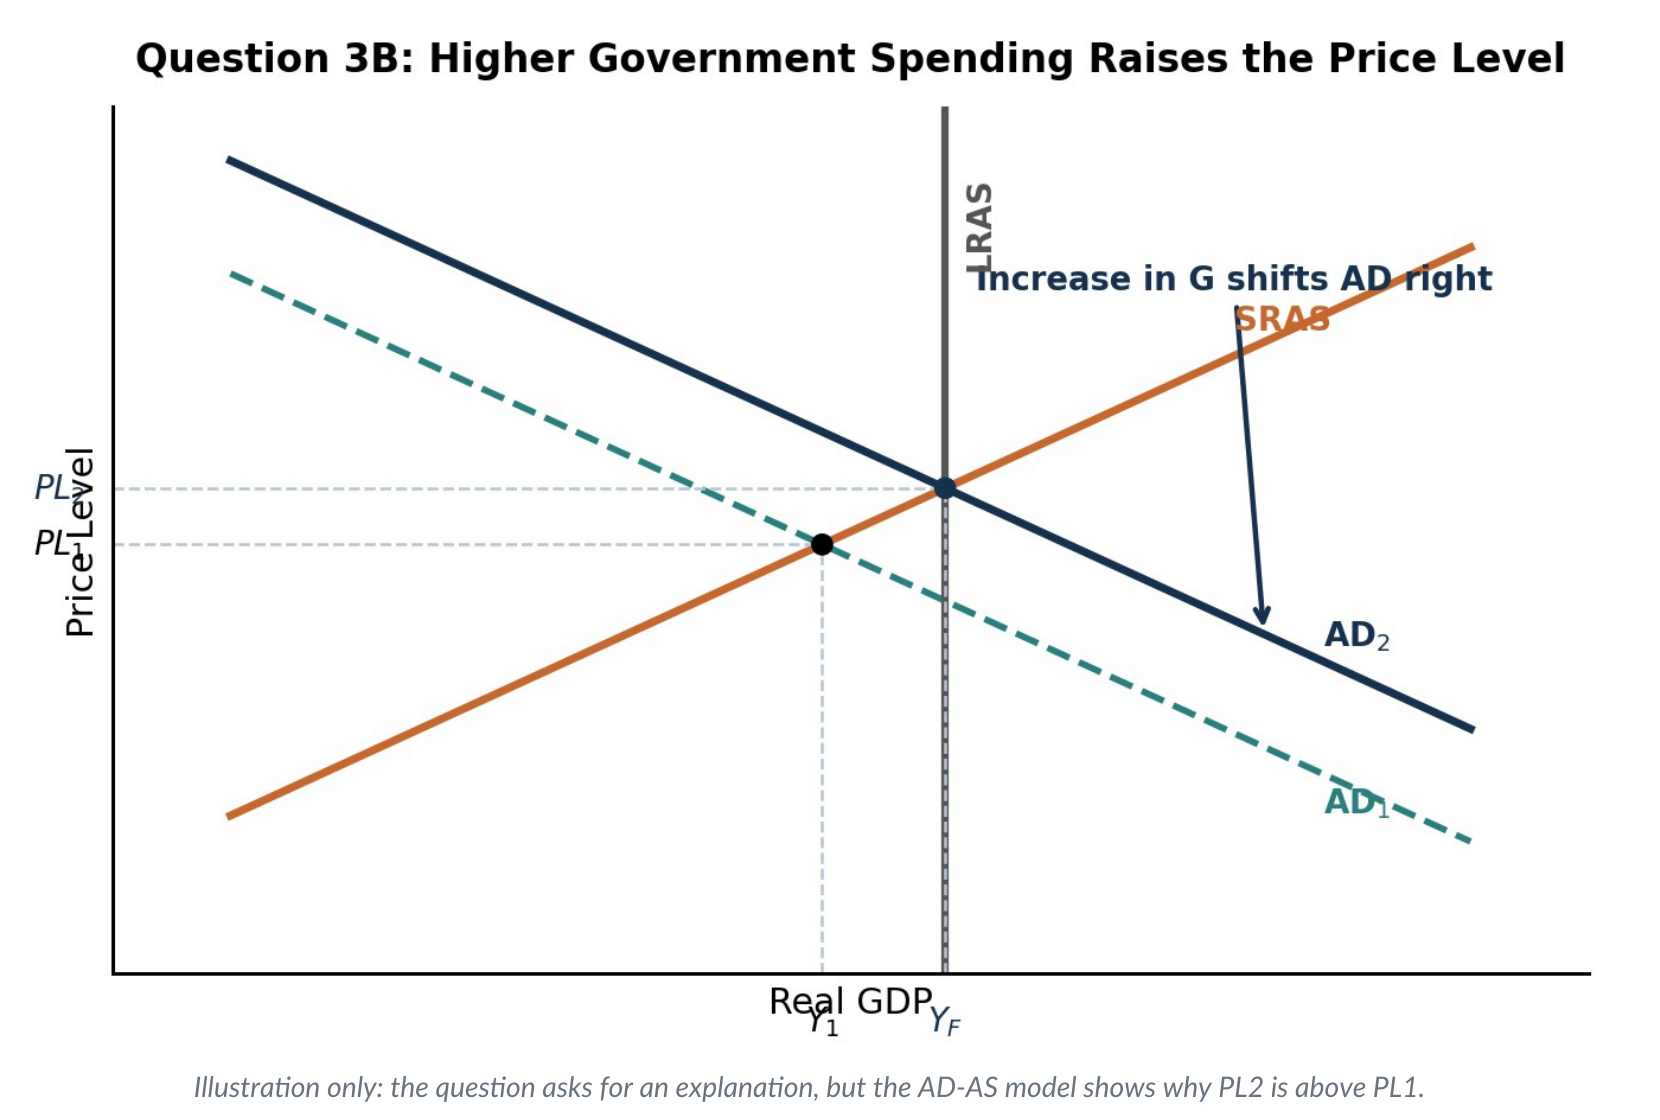
Higher government spending shifts aggregate demand right along an upward-sloping SRAS.
The price level increases. Government purchases are a component of aggregate demand, so the 150 million crown increase in \(G\) shifts AD to the right. With an upward-sloping SRAS, the new short-run equilibrium has both higher real output and a higher price level. The increase in output closes the recessionary gap.
Part C: Foreign Exchange Market for the Lizland Crown
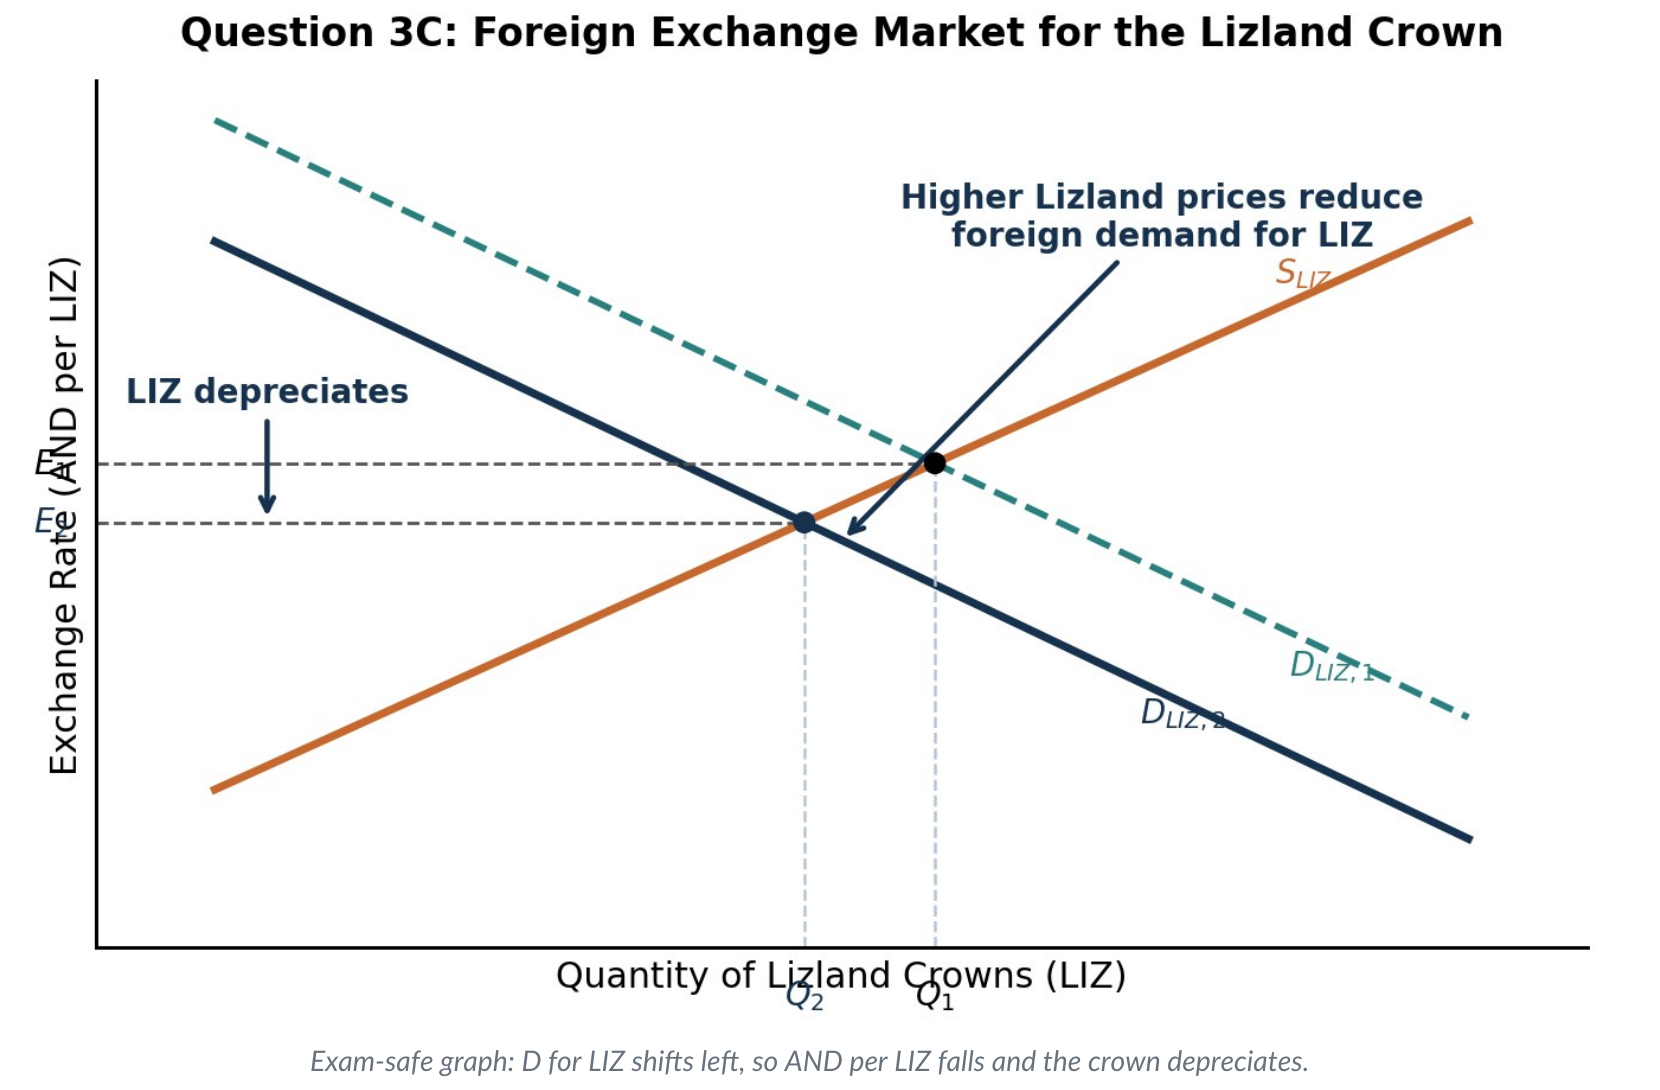
Higher Lizland prices reduce the international value of LIZ.
- Label the market precisely. The graph is for LIZ. Put Quantity of LIZ on the horizontal axis. Put AND per LIZ on the vertical axis because the price of one Lizland crown is measured in Andoh notes.
- Draw currency supply and demand. Draw an upward-sloping supply of LIZ and a downward-sloping demand for LIZ.
- Use the relative-price effect. The higher price level makes Lizland goods and services more expensive to buyers in Andoh. Andoh residents demand fewer Lizland exports and therefore demand fewer LIZ.
- Shift demand and label the result. Shift the demand for LIZ left. The equilibrium exchange rate falls from \(E_1\) to \(E_2\), so the Lizland crown depreciates.
Rehearse Concise Responses
Use this section after studying the detailed reasoning above.
Question 1
A. Draw AD and SRAS intersecting at \(Y_1\) and \(PL_1\). Draw LRAS vertically at \(Y_F\) to the left of \(Y_1\), showing \(Y_1>Y_F\).
B. Because output exceeds full-employment output, unemployment is below the natural rate. Nominal wages and other input prices rise, decreasing SRAS. SRAS shifts left until output returns to \(Y_F\), and the price level rises.
C(i). The central bank conducts an open-market sale of government securities.
C(ii). In the money market, MS shifts left and the nominal interest rate rises from \(i_1\) to \(i_2\).
D(i). International financial capital inflows increase because the higher domestic interest rate offers a higher return on Micanapy financial assets.
D(ii). The price of previously issued bonds decreases.
D(iii). Private domestic investment spending decreases.
E. The unemployment rate increases because lower investment decreases AD and real output, causing employment to fall.
Question 2
A. Employed \(=15{,}000{,}000-900{,}000=14{,}100{,}000\).
B. Unemployment rate \(=(900{,}000/15{,}000{,}000)\times100=6\%\).
C. Draw a downward-sloping SRPC, a vertical LRPC at 3%, and point X at 6% unemployment and 2% inflation.
D. The unemployment rate increases because retirees leave the labor force, decreasing the denominator while the number unemployed remains unchanged.
Question 3
A(i). Decrease an administered interest rate, such as the interest rate paid on reserve balances.
A(ii). \(k_G=1/(1-0.75)=4\); \(\Delta G=600\text{ million}/4=150\text{ million crowns}\). Increase \(G\) by 150 million crowns.
B. The price level increases because higher government spending shifts AD right, creating a higher short-run equilibrium price level along SRAS.
C. In the market for LIZ, shift demand for LIZ left because higher Lizland prices reduce demand for Lizland exports. AND per LIZ falls, so LIZ depreciates.
Four Graphs You Must Label Correctly
A final pre-submission audit for axes, curves, numerical values, and directional changes.
| Graph | Required labels | Required result |
|---|---|---|
| AD-AS (Q1A) | Price Level; Real GDP; AD; SRAS; LRAS; \(Y_1\); \(PL_1\); \(Y_F\) | \(Y_1\) lies to the right of \(Y_F\). |
| Money market (Q1C) | Nominal Interest Rate; Quantity of Money; MD; \(MS_1\); \(MS_2\); \(i_1\); \(i_2\) | MS shifts left; \(i_2>i_1\). |
| Phillips curves (Q2C) | Inflation Rate; Unemployment Rate; SRPC; LRPC; 3%; 6%; 2%; X | LRPC at 3%; X at (6%, 2%). |
| Foreign exchange (Q3C) | AND per LIZ; Quantity of LIZ; \(D_{LIZ}\); \(S_{LIZ}\); \(E_1\); \(E_2\) | Demand shifts left; \(E_2<E_1\); LIZ depreciates. |
Universal Graph Checklist
- The vertical-axis variable is written explicitly, not represented by an unexplained letter.
- The horizontal-axis quantity is the quantity for the market shown.
- Every curve is labeled next to the curve rather than in a disconnected legend.
- The initial and new equilibria are shown at actual intersections.
- Directional shifts are shown with a new curve and clearly distinguished labels such as 1 and 2.
- Numerical values requested by the prompt appear on the correct axes.
- The written answer matches the graph. Never write "depreciates" while drawing a higher exchange rate.
Concepts Behind the 2026 FRQs
1. Output Gaps and Long-Run Self-Adjustment
| Starting condition | Long-run self-adjustment |
|---|---|
| Inflationary gap: \(Y>Y_F\); unemployment below the natural rate. | Nominal wages and input prices rise → SRAS shifts left → output falls to \(Y_F\) → price level rises. |
| Recessionary gap: \(Y<Y_F\); unemployment above the natural rate. | Nominal wages and input prices fall → SRAS shifts right → output rises to \(Y_F\) → price level falls. |
2. Limited Reserves vs. Ample Reserves
| Limited-reserve system | Ample-reserve system |
|---|---|
| An open-market purchase increases the money supply and lowers the nominal interest rate. | Decrease administered interest rates to lower the policy rate. |
| An open-market sale decreases the money supply and raises the nominal interest rate. | Increase administered interest rates to raise the policy rate. |
Use the money market when requested. Use the reserve market only when the prompt requests it.
3. Interest-Rate Transmission Chains
| Interest rate | Immediate effect | Macroeconomic consequence |
|---|---|---|
| Rises | Old bond prices fall; interest-sensitive consumption falls; capital inflows rise. | Investment and AD decrease; output and employment fall; unemployment rises; the currency tends to appreciate through capital inflows. |
| Falls | Old bond prices rise; interest-sensitive consumption rises; capital inflows fall. | Investment and AD increase; output and employment rise; unemployment falls; the currency tends to depreciate through capital outflows. |
4. Labor-Force Identities
Retirees, discouraged workers, and others not looking for work are not in the labor force.
5. Spending Multiplier
Use a positive change for a recessionary gap and a negative change for an inflationary gap.
Thirty-Second Final Check
- Every subpart is labeled exactly as the prompt labels it.
- Every increase, decrease, or remain-the-same question begins with the direction.
- Every explanation names the intermediate economic mechanism.
- Every calculation shows work and includes the direction and unit.
- Every graph has labeled axes, labeled curves, and the requested numerical values.
- All curve shifts are in the correct direction and the written conclusion matches the graph.
- You have not used retired people or people not looking for work as unemployed workers.
- You distinguished limited-reserve tools from ample-reserve tools.
- The exchange-rate axis reads AND per LIZ, not the inverse.
Source and Method Note
The uploaded guide identifies its primary paper as the College Board 2026 AP Macroeconomics Free-Response Questions supplied by the user. It also notes the current AP Macroeconomics Course and Exam Description and graph conventions; the updated Unit 4 material on the financial sector and monetary policy; and 2024 and 2025 AP Macroeconomics scoring guidelines, sample commentaries, and Chief Reader reports as checks for common graph and explanation expectations.