
Land and Water Use
APES Unit 5 Study Notes
Understand how we manage land and water.
Review agriculture, forestry, mining, urbanization and aquaculture with detailed notes, clear diagrams and worked calculations.
5.1 The Tragedy of the Commons
Overview
The tragedy of the commons describes incentives to overuse a shared, subtractable resource when users gain individual benefits while spreading depletion costs among others. Garrett Hardin popularized the term in 1968, but communal ownership does not make failure inevitable. Common-pool resources can be publicly, privately or collectively governed; open access describes a lack of effective exclusion or rules, not the only possible ownership arrangement.
For the AP Environmental Science exam, you must understand why this occurs, provide examples, and recognize solutions to prevent commons depletion.
Why Does Tragedy of the Commons Occur?
Individual Incentive vs. Collective Good
The Problem: Each person gets full personal benefit from exploiting the resource, but the cost of degradation is shared among everyone.
- Shared pasture: Without effective stocking rules, another animal benefits its owner while adding grazing pressure shared by all users. Overuse becomes likely when total grazing exceeds recovery. Community agreements, monitoring and enforceable limits can change these incentives.
- Fishery: A fisher may capture private revenue while reducing a shared stock. Depletion costs differ among fleets, workers and communities; they are not distributed equally. Catch limits, access rights and cooperation can avoid a race to fish.
- Atmosphere: Emitting activities can impose climate or air-pollution costs on others. The shared resource here includes the environment’s capacity to absorb emissions without harmful change. Local air pollutants and long-lived greenhouse gases have different effects and management needs.
Key Features of Commons Depletion
- Open access: No effective exclusion or enforceable access limits. This can occur with or without a legal owner. A community-owned fishery with working rules is different from an unmanaged open-access fishery.
- Nonexcludability: Difficult/impossible to prevent others from using
- Limited Supply: Resource is finite; overuse reduces availability
- Individual incentives: A user may gain from additional use while sharing the costs. This model does not assume all people act only for immediate personal profit; norms, cooperation, rights and unequal power can alter behaviour.
- Collective outcome: Uncoordinated decisions can exceed resource regeneration and harm users. Outcomes depend on institutions, knowledge, power and enforcement; collapse is a risk rather than a necessary result of every shared resource.
Real-World Examples
- Fisheries: The northern cod collapse illustrates severe overexploitation and management failure. Conditions and recovery vary by stock; do not treat all cod or bluefin tuna populations as identical or permanently collapsed.
- Groundwater Aquifers: Farmers pump aquifers faster than recharge rate; water table drops; wells run dry; everyone loses water access
- Forests: Weakly governed access can encourage excessive cutting, while public, private and community forests can all have effective or ineffective management. Ownership labels alone do not predict the outcome.
- Atmosphere and climate: Activities that emit greenhouse gases can give private benefits while imposing climate costs beyond the emitter. Impacts are global but uneven, and emissions differ greatly among people, companies and countries.
- Rangelands: Stocking beyond forage recovery can reduce vegetation cover, compact soil and increase erosion. Severe degradation or desertification is possible, particularly with drought and poor management, but collapse is not inevitable in every shared pasture.
- Wildlife: Passenger pigeons hunted to extinction; some whale species nearly extinct; bison nearly exterminated
Solutions to Prevent Commons Depletion
- Defined rights: Secure access or property rights can improve incentives where boundaries and enforcement are feasible. Private owners can still externalize damage or prioritize short-term returns, so rights need suitable safeguards and do not solve every global commons problem.
- Government Regulation: Set quotas, licenses, hunting seasons; enforce limits through penalties (fishing quotas, hunting licenses)
- Community Management: Local groups self-regulate commons (community forests, water user associations)
- International Agreements: Treaties and protocols to manage shared resources (CITES for endangered species, Montreal Protocol for ozone, whaling moratoriums)
- Economic Incentives: Carbon taxes, cap-and-trade systems, payments for ecosystem services
- Technology: Monitoring systems, enforcement technology, sustainable alternatives
- Education/Culture: Shift values toward sustainability and long-term thinking
Common pitfall: Separate the resource’s characteristics from its ownership and governance. Fisheries, groundwater and grazing can be difficult to exclude users from and subtractable in use. Open-access depletion is not proof that all communal or government ownership fails. Community institutions, regulation, rights and cooperation can work in combination.
Worked incentive example
Suppose one additional grazing animal gives its owner 80 currency units of benefit but imposes 120 units of total pasture damage shared equally among ten users. The owner bears only units of that damage, leaving a private gain of . Across the group, the net change is . These hypothetical marginal values illustrate an incentive mismatch, not an assertion that every community behaves identically. Rules or payments can align private and collective incentives.
5.2 Clearcutting
Overview
Clearcutting removes most or all overstory trees within a defined harvest area to establish a new, usually even-aged cohort. Retained habitat trees, buffers or reserves may remain. It can have high short-term timber efficiency and substantial ecological impacts, but profitability and sustainability depend on forest type, site, harvest extent, regeneration and protection measures. It is not a universal synonym for permanent deforestation.
For the AP Environmental Science exam, you must know the process, its environmental impacts, economic benefits, and sustainable alternatives.
What is Clearcutting?
Process
- Most or all overstory trees are removed in the harvest area; specific prescriptions can retain habitat trees or protected patches. The purpose is to regenerate a largely new age cohort.
- Most canopy is removed within the regeneration area; buffers and retained structures may remain under the prescription.
- Heavy machinery compacts remaining soil
- Slash (branches, bark) often burned or left to rot
Why Use Clearcutting?
- Operational economics: Concentrated harvesting can reduce extraction costs and yield a large timber volume per operation. Profit also depends on roads, terrain, timber markets, regeneration and environmental requirements; it is not always the most profitable method.
- Harvest concentration: Concentrated operations can be rapid and cost-effective in suitable terrain. Operational efficiency must be distinguished from ecosystem recovery, long-term yield and protection of soil and water.
- Timing of returns: Harvest produces immediate revenue, while future timber, carbon, biodiversity and water effects require a longer accounting period. A planned rotation and an exploitative clearing operation can have different objectives and outcomes.
- Planning: Mechanized operations can be simpler to organize than dispersed selection, but still require skilled layout, safety, regeneration planning and protection of soils and streams.
Environmental Impacts of Clearcutting
- Soil Erosion: Exposed soil washes away in heavy rains; topsoil loss reduces fertility for regrowth
- Water Pollution: Sediment-laden runoff clouds waterways; covers stream substrate smothering aquatic life
- Habitat Loss: Destroys shelter for wildlife; fragmentation isolates populations; many species require forest interior
- Biodiversity change: Forest-interior and old-growth-dependent species can decline while some early-successional species increase. Species richness alone does not show that the original community or its ecological functions have been retained.
- Hydrological changes: Reduced interception and transpiration can increase water yield after harvest, while roads and compaction may accelerate runoff or reduce local infiltration. Streamflow and groundwater responses vary with slope, soils, rainfall and recovery; a universally lower water table is not expected.
- Nutrients: Biomass removal exports nutrients; exposed soils can lose nutrients by erosion and leaching. Ash often raises pH temporarily by adding base cations, although burning can also volatilize nutrients. Ash does not generally acidify soil simply because it is ash.
- Microclimate Changes: Loss of shade increases temperature extremes; wind damage to remaining vegetation
- Carbon Release: Reduced carbon sequestration; decomposition of slash releases
Recovery After Clearcutting
- Pioneer Species: Fast-growing, shade-intolerant species colonize first (weeds, grasses, shrubs)
- Mono-Plantations: Often replanted with single species (often non-native) instead of diverse native forest
- Long Recovery: Can take 200+ years for old-growth forest characteristics to return; often never fully recovered
- Rotations and landscape pattern: Short rotations may prevent late-successional structures from developing. Their timing and spatial arrangement affect habitat connectivity; 30–40 years is an example rather than a universal rotation length.
- Loss of Old-Growth: Species requiring old-growth forests (spotted owls, northern flying squirrels) disappear; entire ecosystems lost
Sustainable Alternatives
- Selection forestry: Remove appropriate individuals or groups while maintaining desired size classes and regeneration. Benefits depend on careful implementation; high-grading valuable trees alone is not sustainable management.
- Shelterwood Cutting: Remove trees in stages; provides shade and shelter for regeneration
- Variable retention: Retain trees, groups, snags or logs to preserve biological legacies. Retention levels and patterns depend on site, habitat needs and management objectives rather than a universal percentage.
- No-cut/Protection: Designate old-growth reserves; protect remaining ancient forests
- Reforestation with Native Species: Plant diverse native species instead of monocultures
Exam tip: Link canopy removal, soil disturbance and roads to erosion, stream temperature, habitat and carbon effects. Distinguish regeneration of tree cover from recovery of old-growth structures, which can take centuries. Compare actual management prescriptions and site conditions rather than label every clearcut sustainable or unsustainable in all circumstances.
5.3 The Green Revolution
Overview
The Green Revolution expanded crop productivity, particularly from the mid-twentieth century, through improved varieties, irrigation, fertilizers, pest control and supporting infrastructure. Large gains in rice and wheat helped food supplies in many regions, but benefits and environmental costs varied. Greater food availability does not ensure equitable access or eliminate hunger caused by poverty, conflict and distribution problems.
For the AP Environmental Science exam, you must know the technologies involved, the benefits, the environmental impacts, and regional variations.
Technologies of the Green Revolution
1. High-Yield Crop Varieties (HYVs)
- Selective Breeding: Developed crops with higher grain/fruit yield, shorter growing season, disease resistance
- Famous Breeder: Norman Borlaug ("Father of Green Revolution"); developed dwarf wheat varieties
- Key Crops: High-yield rice, wheat, corn (maize) varieties
- Result: Dramatically increased calorie production per hectare; multiple harvests per year possible
2. Synthetic Fertilizers
- Nitrogen Fertilizers: Haber-Bosch Process enables mass production of ammonia; allows massive nitrogen application
- Phosphorus Fertilizers: Mined from phosphate deposits; applied to supplement soil
- Effect: Fertilizers can replace exported nutrients and raise yields where nutrients limit growth. They do not by themselves maintain organic matter, prevent erosion or replace every aspect of healthy soil management.
- Problem: Excess runoff causes eutrophication; water pollution
3. Pesticides and Herbicides
- Chemical Pest Control: Synthetic pesticides (DDT, organophosphates, pyrethroids) kill crop-damaging insects
- Herbicides: Chemical weedkillers increase crop yield by reducing competition
- Effect: Dramatically increased yields; reduced crop losses to pests
- Problems: Pesticide resistance, bioaccumulation, nontarget species killed, ecosystem disruption
4. Irrigation Technology
- Water Management: Dams, canals, pumps; enables agriculture in semi-arid regions
- Multiple Cropping: Reliable water supply allows 2-3 harvests per year instead of one
- Effect: Turned marginal lands into productive agricultural areas
- Problems: Aquifer depletion, salinization, water conflicts, ecosystem degradation
Success and Positive Impacts
- Food availability: Yield gains helped avert severe food shortfalls in some regions and supported larger populations. It is an overstatement to attribute prevention of all global famine to a single technology package; access, policy, trade and public health also mattered.
- Yield gains: Some crops and regions experienced several-fold increases over particular periods. Distinguish yield per hectare from total production, which also changes with harvested area, cropping frequency and losses.
- Reduced Hunger: Lower food prices; more people have access to adequate nutrition
- Economic Development: Increased agricultural surplus enabled investment in other sectors
- Preserved Forests: By increasing productivity on existing farmland, reduced need to clear additional forests (though this benefit is debated)
- Poverty Reduction: Economic growth from agricultural surplus helped lift people out of poverty
Negative Environmental Impacts
- Soil Degradation: Monocultures deplete soil; erosion increases; organic matter declines
- Water Pollution: Excess fertilizer runoff causes eutrophication; pesticide contamination
- Water depletion: Irrigation can deplete aquifers when withdrawals and reduced return flows exceed sustainable replenishment. The High Plains/Ogallala aquifer and groundwater use in the Indus basin are distinct examples; the Indus River itself is not an aquifer.
- Biodiversity Loss: Monocultures replace diverse wild plants; pesticides kill nontarget insects, birds, soil organisms
- Pest Resistance: Heavy pesticide use selects for resistant insects; pest control becomes less effective over time
- Salinization: Excessive irrigation deposits salts in soil; reduces productivity; creates unusable land
- Energy demand: Industrial ammonia synthesis is energy-intensive and has commonly used fossil-derived hydrogen and energy. Low-emission alternatives exist; impacts depend on the feedstock and power source. Farm machinery, irrigation and transport also use energy.
- Loss of Genetic Diversity: Traditional crop varieties abandoned; genetic heritage lost; vulnerability to new pests/diseases
- Farmer Dependence: Small farmers dependent on expensive inputs (seeds, fertilizer, pesticides); debt and vulnerability
Common pitfall: Evaluate production, food access and environmental effects separately. Higher yields can reduce pressure to expand farmland, but profits can also encourage expansion. Nutrient losses, water depletion, resistance, biodiversity and farmer access to inputs depend on how the package is implemented.
5.4 Impacts of Agricultural Practices
Overview
Agricultural practices have profound impacts on environmental quality. Modern intensive agriculture, while productive, creates multiple environmental problems including soil degradation, water pollution, habitat loss, and climate impacts.
For the AP Environmental Science exam, you must understand how different farming practices affect ecosystems and recognize sustainable alternatives.
Major Environmental Impacts
Soil-Related Impacts
- Erosion: Disturbance and inadequate ground cover can expose soil to wind and water. Rates depend on rainfall, slope, soil and management; do not attach a single undated global tonnage to all agricultural erosion.
- Compaction: Heavy machinery compacts soil; reduces water infiltration and air spaces for roots and organisms
- Salinization: Irrigation water carries dissolved salts. Evaporation and crop water use leave salts behind, especially where drainage and leaching are inadequate. Rising saline groundwater can worsen the problem; water application alone does not make every irrigated soil unusable.
- Nutrient balance: Harvest exports nutrients. Soil organic matter and fertility depend on residue return, rotations, amendments, erosion and biological processes. Continuous production does not require indefinitely increasing fertilizer if inputs and losses are appropriately balanced.
- Loss of Structure: Monocultures reduce soil aggregation; makes soil more vulnerable to erosion
Water-Related Impacts
- Nutrient losses: Nitrogen and phosphorus can stimulate algal growth; decomposition and respiration can then deplete oxygen. Northern Gulf of Mexico hypoxia varies strongly by year and conditions, so a single 15,000 k area should not be treated as a permanent size.
- Pesticide contamination: Movement to water and persistence depend on the compound, application, soils and weather. Some persistent chemicals bioaccumulate or biomagnify; these properties do not apply equally to every pesticide.
- Aquifer Depletion: Over-irrigation drains groundwater; wells run dry; agricultural collapse when aquifer is exhausted
- Runoff Volume: Loss of vegetation and soil infiltration increases surface runoff; flooding, stream erosion, sedimentation
- Water diversion: Irrigation can reduce downstream flows and alter wetlands. Diversion of the Amu Darya and Syr Darya contributed to the Aral Sea’s contraction; it is an inland lake, not a river outlet to the ocean.
Biodiversity Impacts
- Habitat Loss: Agricultural conversion destroys native ecosystems; major driver of species extinction
- Pesticide Effects: Kill nontarget insects; reduce food for birds and other wildlife; cause population crashes
- Genetic Erosion: Traditional crop varieties replaced by monocultures; genetic diversity loss
- Pollinator Decline: Neonicotinoid pesticides harm honeybees, butterflies, and wild pollinators; threatens food production
Climate Impacts
- Greenhouse Gas Emissions: Fertilizer production (Haber-Bosch Process) energy-intensive; fossil fuel inputs; methane from livestock and rice paddies
- Carbon Release: Tilling releases soil carbon; deforestation for agriculture eliminates carbon sinks
- Emissions accounting: Agricultural methane and nitrous oxide are important. Totals differ depending on whether land-use change, fertilizer manufacture, energy, processing and transport are included. Specify the inventory year and system boundary before assigning a percentage to agriculture or the food system.
- Feedback Loop: Climate change (drought, floods) threatens agricultural productivity; agriculture accelerates climate change
💡 Exam Tip: Agriculture affects MULTIPLE environmental systems simultaneously: soil (erosion, degradation), water (pollution, depletion), biodiversity (habitat loss), and climate (emissions). Be able to explain connections between practices and impacts. Major dead zones from agricultural nutrient runoff. Pesticides harm nontarget species. Fertilizer production energy-intensive. Irrigation depletes aquifers.
5.5 Irrigation Methods
Overview
Irrigation is artificial water application to land for agricultural production. Different irrigation methods have varying efficiency, cost, and environmental impacts. Understanding these methods is crucial for understanding water use and sustainability in agriculture.
For the AP Environmental Science exam, you must know different irrigation methods, their efficiency, advantages, and disadvantages.
Types of Irrigation Methods
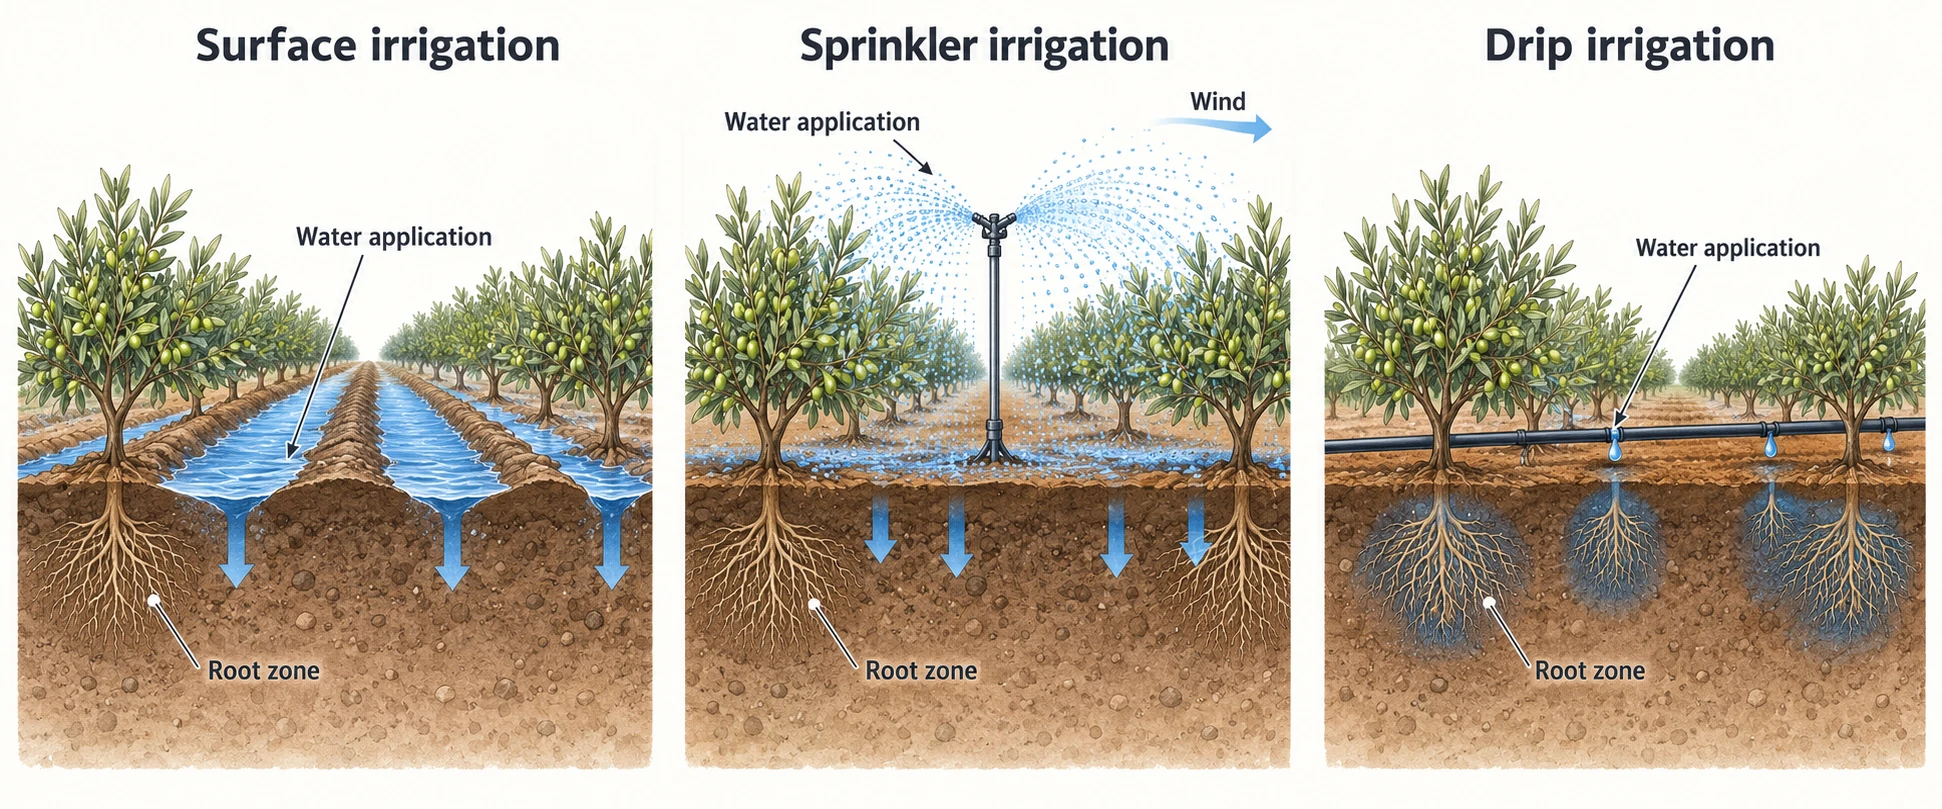
1. Flood Irrigation (Furrow/Basin)
- Method: Water diverted into furrows or basins; gravity flows across field
- Application efficiency: A classroom example may use 40–50%, but well-managed surface systems can perform differently. Losses can include runoff, evaporation or drainage below roots. Their recoverability elsewhere matters for basin-wide water use.
- Advantages: Gravity delivery can use relatively simple equipment and low pumping pressure. Suitability depends on land levelling, slope, soil infiltration and crop; steep or irregular slopes can make uniform surface application difficult.
- Disadvantages: Wasteful; poor water distribution; causes waterlogging and salinization
- Suitable settings: Surface irrigation is used for several crops where field grading, soils and available water allow it. Choice depends on local conditions and investment, not a simple developing-country versus developed-country division.
2. Sprinkler Irrigation (Center Pivot)
- Method: Water sprayed through overhead sprinklers; mimics rainfall
- Application efficiency: A classroom comparison may use 60–80%. Wind, pressure, nozzle design, scheduling and maintenance affect actual performance. Low-pressure or carefully managed systems can differ from this illustrative range.
- Advantages: Better water distribution; works on uneven terrain; uniform application
- Disadvantages: High cost; energy-intensive (pumping); wind affects distribution; evaporation losses
- Best for: Corn, wheat, vegetables in developed regions
3. Drip Irrigation (Trickle)
- Method: Water delivered directly to plant roots through perforated tubes; minimal distribution loss
- Application efficiency: Well-designed and maintained drip systems can achieve high field efficiency, often illustrated near 90%. Clogging, leakage, poor scheduling and salt management still matter; the technology does not guarantee a fixed value.
- Advantages: Localized application can limit evaporation from unwetted ground and deliver water or nutrients precisely. Matching delivery to crop need is essential; a highly efficient field can still overdraw an aquifer or expand total irrigated demand.
- Disadvantages: Highest initial cost; maintenance required; can clog with sediment or salt
- Best for: High-value crops (vegetables, fruits) in water-scarce regions; Israel uses drip extensively
Irrigation Efficiency Comparison
| Method | Efficiency | Cost | Water Loss |
|---|---|---|---|
| Flood | Illustrative 40–50%; varies | Low | High (evap + seepage) |
| Sprinkler | Illustrative 60–80%; varies | High | Moderate (evaporation) |
| Drip | Often high when well managed; varies | Often high initial investment | Localized application; losses still possible |
Exam tip: Compare water delivered with beneficial root-zone storage under stated assumptions. Drip often has high application efficiency but requires maintenance and appropriate design. Field savings need not equal basin savings if return flows change or irrigated area expands. Agriculture accounts for roughly 70% of global freshwater withdrawals in common FAO summaries; withdrawal is distinct from consumption and varies by region and year.
Worked irrigation requirement and savings
Definition: For this simplified field comparison, Use the efficiency as a decimal. A crop needs 6,000 of beneficial root-zone water. At 50% efficiency the required application is At 90% efficiency, The application reduction is The same crop demand and area were assumed. This does not establish a 44.4% reduction in basin consumption because some previous drainage may have been reusable downstream.
5.6 Pest Control Methods
Overview
Pest control methods range from chemical pesticides to biological controls to cultural practices. Each has tradeoffs between effectiveness, cost, and environmental impact. Understanding these methods is essential for discussing sustainable agriculture.
For the AP Environmental Science exam, you must know different pest control approaches, their advantages, disadvantages, and impacts.
Types of Pest Control
1. Chemical Pesticides (Synthetic)
- Advantages: Fast-acting; effective immediately; broad spectrum kills many pests; relatively inexpensive
- Risks: Effects depend on toxicity, dose, exposure, persistence and application. Some products harm natural enemies or pollinators; repeated selection can favour resistance. Persistent compounds may accumulate in food webs, while others break down rapidly.
- Types: Organophosphates, pyrethroids, neonicotinoids, carbamates
- Examples: Certain neonicotinoid exposures can harm pollinators, alongside other drivers such as habitat loss and disease. Persistent DDT and its metabolite DDE contributed to eggshell thinning and declines in birds including bald eagles; do not generalize this mechanism to every pesticide.
2. Biological Controls
- Natural Enemies: Introduce predators, parasites, or pathogens of pests (ladybugs eat aphids; parasitic wasps)
- Potential benefits: Conserving or augmenting appropriate natural enemies can suppress pests and reduce some pesticide use. Effects depend on the organism and conditions; control need not be self-sustaining or perfectly species-specific.
- Disadvantages: Slower than chemicals; may not completely eliminate pest; introduced species can become invasive
- Examples: The introduced cane toad illustrates serious non-target harm, not successful control of Australian cane beetles. Appropriate parasitoids and predators can control specific pests; Bt products affect susceptible insects, with activity differing among strains and toxins.
3. Cultural and mechanical controls
- Methods: Crop rotation, intercropping, hand-picking, row covers, trap crops, timing plantings
- Potential advantages: Appropriate cultural practices can prevent pest buildup and reduce treatment needs without applying a pesticide. Labour, equipment, water use and habitat effects still depend on the practice; no approach has uniformly minimal impact or cost.
- Disadvantages: Labor-intensive; less effective for large-scale monocultures; slower results
- Examples: Rotation can disrupt host-specific pest cycles, but broad-host pests may persist. Intercropping, planting dates, exclusion nets and physical removal work through different mechanisms; choose them for the pest and production system.
4. Genetic Engineering (GMO Pest Control)
- Bt Crops: Insert Bacillus thuringiensis toxin genes; plants produce insecticide; kills caterpillars that eat crop
- Advantages: Reduces pesticide spraying; targeted at specific pests; effective
- Disadvantages: Resistance developing; impacts nontarget organisms; genetic escape concerns; consumer acceptance issues
- Resistance and non-target assessment: Susceptible pests can evolve resistance to Bt traits, so refuges, monitoring and other resistance-management practices matter. Effects on non-target organisms depend on exposure and the particular toxin and crop, not the GMO label alone.
Common pitfall: Chemical products can be effective but differ in speed and selectivity. Biological controls can also have risks. IPM combines prevention, identification, monitoring and suitable interventions; neither natural origin nor synthetic origin proves that an option is harmless or effective.
5.7 Meat Production Methods
Overview
Meat production has significant environmental impacts including land use, water consumption, feed production, and greenhouse gas emissions. Different production systems (conventional feedlots vs. pasture-based) have different environmental footprints.
For the AP Environmental Science exam, you must understand different production methods and their environmental impacts.
Production Systems
1. Conventional Feedlots (Concentrated Animal Feeding Operations - CAFOs)
- System: Feedlots finish cattle on concentrated rations; animal feeding operations also include other livestock systems. CAFO is a regulatory category involving confinement and specified criteria, not a synonym for every large farm or a fixed feed-conversion efficiency.
- Advantages: Efficient land use; rapid growth; low-cost production; consistent supply
- Environmental Impacts: Massive waste accumulation (manure); water and air pollution; requires large grain input; methane emissions
- Animal Welfare: Crowded conditions; disease risk; stress
- Production context: Many cattle enter feedlots after earlier grazing phases, while poultry and pig systems differ. Avoid combining all species into an unsupported claim that 95% of beef, chicken and pork comes from CAFOs.
2. Pasture-Based Systems
- System: Animals graze on pasture; feed themselves; more extensive use of land
- Potential advantages: Appropriately managed grazing can disperse manure, maintain cover and provide opportunities for natural behaviour. Animal welfare, biodiversity and soil-carbon outcomes depend on stocking, water, shelter, habitat and management; pasture is not automatically superior on every measure.
- Disadvantages: Requires more land; slower growth; higher labor costs; less efficient resource use; risk of overgrazing
- Sustainability: Can be sustainable if managed well; risk of degradation with overstocking
- Growing Trend: "Grass-fed beef," regenerative grazing practices gaining popularity
Environmental Impact Comparison
- Land: Feedlots occupy little finishing space, but feed production and earlier grazing add land demand. Pasture systems can need more area per unit of product; clearing native vegetation for grazing, including in the Amazon, can have large carbon and habitat costs.
- Water: Distinguish rainfall used by vegetation from irrigation and drinking water withdrawals. Climate, feed origin, animal growth and system boundary affect comparisons; pasture does not universally require less water per kilogram of beef.
- Pollution: Feedlots - concentrated waste; water pollution; air pollution; Pasture - dispersed; less acute pollution
- Feed conversion: Specify dry feed or grain, live-weight gain, carcass weight or edible product before comparing ratios. A single 7 kg grain per kg beef value is not universal, and grain-only accounting omits forage and earlier life stages.
- Greenhouse Gases: Both produce methane; feedlots have grain production emissions; pasture-based may sequester carbon
- Resource demand: Livestock uses extensive grazing land and cropland for feed while supplying animal foods and livelihoods. Widely quoted global land and calorie shares depend on the dataset, year and boundary; they do not describe every species or region equally.
Exam tip: Compare equal quantities of the same nutritional output with a stated life-cycle boundary. Include feed land, manure, enteric methane, energy, water sources and land-use change. Soil-carbon gains under grazing can be useful but are finite, variable and not proof that all methane or clearing emissions are offset.
5.8 Impacts of Overfishing
Overview
Overfishing means fishing mortality is too high to sustain a stock’s productive capacity under the management benchmark. An overfished stock has biomass below its benchmark; the two conditions are related but distinct. Recruitment, growth, natural mortality, habitat and environmental variability affect stock dynamics, so reproduction alone is not the entire balance.
For the AP Environmental Science exam, you must understand overfishing causes, impacts, and solutions (fishery management).
Causes of Overfishing
- Access and incentives: Weakly governed open access can promote a race to fish. Territorial rights, community management and public regulation can create effective access rules; a public or shared fishery is not necessarily unmanaged.
- Advanced Technology: Industrial fishing vessels (factory ships) can catch enormous quantities; sonar locates fish; large nets capture everything
- Economic Pressure: Fishing communities need income; subsidies encourage overexpansion of fishing fleets
- Global Demand: Increasing seafood consumption; fish prices high; incentivizes extraction
- Lack of Enforcement: International waters have limited regulation; illegal fishing hard to prevent
Impacts of Overfishing
Population Collapse
- Northern cod: Severe depletion led to a moratorium in 1992 off Newfoundland and Labrador. Recovery and reopening decisions are stock-specific and depend on dated assessments; do not infer that all Atlantic cod stocks share one status or recovery trajectory.
- Bluefin tuna: Atlantic, Pacific and southern bluefin involve different stocks and management histories. Some have improved under controls while others remain under pressure. A single undated 90% Mediterranean decline should not stand in for their current assessments.
- Sharks: Fishing mortality, including retained catch, bycatch and finning, threatens many slow-growing species. Finning specifically removes fins and discards the body; estimates of all sharks killed by fisheries are not estimates of finning alone.
- Dated global assessment: FAO’s 2025 review assessed 2,570 marine fish stocks for the 2021 base year: 35.5% were classified as overfished and 64.5% within biologically sustainable levels. A stock fished at its sustainable limit is not automatically overfished; stock-count percentages also differ from catch-weighted percentages.
Ecosystem Effects
- Trophic Cascade: Removal of top predators allows prey to proliferate; disrupts food web
- Bycatch: Non-target species killed; endangered species affected; dolphins, sea turtles, seabirds die in fishing nets
- Habitat Damage: Bottom trawling destroys seafloor ecosystems; takes decades to recover
- Biodiversity Loss: Genetic diversity within fish populations reduced; evolution of smaller-sized fish
- Regime shifts: Severe depletion can alter food webs and make recovery difficult, sometimes contributing to persistent alternative states. A shift is not necessarily permanent, and fishing pressure is not the only influence on recruitment or ecosystem recovery.
Economic and Social Impacts
- Fishing Industry Collapse: When stocks crash, fisheries close; communities dependent on fishing lose income
- Food Security: Over 1 billion people depend on fish as primary protein; overfishing threatens food security
- Unemployment: Fishing communities face economic hardship; difficult to transition to other industries
- Price Increase: Scarcer fish = higher prices; particularly impacts poor populations
Solutions to Prevent Overfishing
- Fishing Quotas: Limit total catch; distribute as individual transferable quotas (ITQs)
- Marine Protected Areas: Establish no-take zones where fishing prohibited; allows population recovery
- Fishing Moratoriums: Temporarily close fisheries (e.g., Atlantic cod moratorium 1992)
- Gear Restrictions: Limit fishing methods (prohibit bottom trawling, shark finning); reduce bycatch
- International Agreements: Treaties managing shared fish stocks; enforcement across national boundaries
- Aquaculture: Farming can add food supply and sometimes substitute for wild catch, but wild feed ingredients, habitat conversion and market responses can maintain pressure. It is not a substitute for managing wild stocks.
- Reduce Consumption: Lower seafood demand reduces fishing pressure
Exam tip: Distinguish overfishing, an overfished stock and sustainable fishing at a high utilization level. Explain bycatch, habitat effects and community impacts, then connect each management measure to a mechanism. Use stock-specific, dated evidence rather than repeat an undated “90% overfished” claim.
5.9 Impacts of Mining
Overview
Mining extraction of minerals from earth has severe environmental impacts including habitat destruction, water pollution, air pollution, and acid mine drainage. Mining is often in biodiverse regions; impacts persist long after mining ceases.
For the AP Environmental Science exam, you must understand mining processes, environmental impacts, and restoration challenges.
Types of Mining and Impacts
1. Surface Mining (Open-pit, Mountaintop Removal)
- Process: Remove overburden (top layers); extract ore; leaves massive holes/scars
- Impacts: Habitat destruction; erosion; water pollution; visual blight; dust
- Mountaintop Removal (coal): Blasts off mountain tops; deposits waste in valleys; devastates Appalachian ecosystems
- Recovery: Difficult; often leaves permanent scars; biodiversity rarely fully recovers
2. Subsurface Mining (Underground)
- Process: Underground tunnels; less surface disturbance; more expensive and dangerous
- Impacts: Subsidence (ground collapse); tailings (mine waste) dumped; acid mine drainage; water contamination
- Acid mine drainage: Sulfide minerals exposed to oxygen and water can oxidize, often with microbial assistance, releasing acidity and mobilizing metals. Surface and underground workings, waste rock and tailings can all generate it; not every mine drain is acidic.
3. Placer Mining
- Process: Extract minerals from stream beds/sediments; panning, sluicing, dredging
- Impacts: Stream channel disruption; habitat destruction; sedimentation; mercury pollution (gold mining)
- Gold extraction: Mercury amalgamation is used in some artisanal and small-scale gold mining and can contaminate ecosystems. Placer operations do not all use mercury; processing methods and regulations vary.
Major Environmental Impacts
- Habitat Destruction: Mining in biodiverse regions (tropics, mountains); fragments ecosystems
- Water Pollution: Heavy metals (lead, mercury, cadmium, copper) contaminate water; bioaccumulate; toxic to aquatic life and humans
- Acid Mine Drainage: Low-pH water persists years/decades after mining closes; kills aquatic life; corrosive infrastructure
- Air Pollution: Dust particles; particulate matter; respiratory health impacts
- Tailings Ponds: Massive waste repositories; can rupture (Mount Polley 2014); contaminate waterways
- Biodiversity Loss: Species in mining areas often endemic (found nowhere else); extinction risk
- Communities and rights: Mining can affect Indigenous lands, water, cultural sites and livelihoods. Impacts and governance differ; meaningful participation, rights, consultation and agreements matter rather than assuming every project has the same history.
Reclamation and Restoration
- Challenges: Highly disturbed sites; contamination persists; restoration expensive and difficult
- Attempts: Replanting, water treatment, capping; often only partially successful
- Long-term liability: Many abandoned or poorly closed sites require extensive restoration or ongoing water treatment. Outcomes depend on geology, contamination, closure planning and funding; restoration of vegetation is not proof that original ecological function has returned.
- Better Approach: Prevention (more efficient recycling, reduce consumption); protect remaining pristine areas from mining
💡 Exam Tip: Mining = severe, long-lasting environmental damage. Habitat destruction (often in biodiversity hotspots); water pollution (heavy metals, acid mine drainage); air pollution; tailings dams risk. Acid mine drainage persists for decades+ after mining ends. Impacts often on indigenous lands. Prevention better than remediation. Know mountaintop removal impacts Appalachia!
Distinguish waste types and the acid-drainage pathway
Waste rock is excavated material not processed as ore; tailings are the finer residues remaining after mineral processing. Either may contain reactive sulfides. Oxygen and water exposure can create acidity, mobilize metals and generate drainage that requires long-term treatment. Acid generation depends on sulfide content and neutralizing minerals; acidic, neutral and alkaline mine drainage all occur.
Mechanism: Removing soil and overburden changes runoff and erosion; crushing exposes mineral surface area; oxidation changes water chemistry. Rehabilitation can stabilize land and support vegetation without recreating the original hydrology or eliminating treatment needs. Compare avoided impacts from reduced demand and recycling with the energy and losses of recovery.
5.10 Impacts of Urbanization
Overview
Urbanization changes settlement patterns and converts land for buildings, roads and infrastructure. UN World Urbanization Prospects 2025 estimates that cities under its harmonized Degree of Urbanization definition house 45% of the global population. This excludes separate towns and semi-dense categories and is not directly comparable to older figures based on national urban definitions. Study both settlement growth and how urban form affects resources.
For the AP Environmental Science exam, you must know urbanization impacts and sustainable city planning approaches.
Environmental Impacts of Urbanization
Habitat Loss
- Direct Loss: Forests, wetlands, grasslands replaced with buildings, roads, parking lots
- Fragmentation: Remaining habitat broken into isolated patches; prevents species movement
- Edge Effects: Urban-habitat boundary creates altered microclimates, increased predation, pollution
- Result: Biodiversity loss; extinction of species requiring large territories
Water Impacts
- Stormwater Runoff: Impervious surfaces (asphalt, concrete) prevent infiltration; increased surface runoff; flooding; erosion
- Pollution: Urban runoff carries oils, heavy metals, salts, fertilizers; contaminates waterways
- Altered hydrology: Connected impervious surfaces commonly speed storm runoff and can reduce local infiltration. Leaking pipes, imported water, irrigation, drainage and geology can alter groundwater recharge in either direction. Urban heat and land cover can also affect local rainfall and water temperature.
- Wetland Loss: Wetlands drained for development; lost water filtration and storage capacity
- Water Demand: Cities consume vast water quantities; strain on water supplies
Air Quality
- Emissions: Vehicles, industry, heating produce air pollution; smog in cities
- Health Impacts: Air pollution causes respiratory diseases, cancer, premature death
- Heat Islands: Paved surfaces absorb heat; cities warmer than surrounding areas; increases energy use, stress on wildlife
- Particulate Matter: Fine particles penetrate lungs; health risks from dust, vehicle emissions
Soil and Waste
- Soil Burial: Native soils covered by buildings, roads; soil services lost; limited green space
- Contamination: Industrial legacy pollution; brownfields; soil testing required before redevelopment
- Waste Generation: Urban areas generate massive waste volumes; landfills overflow; recycling insufficient
- Urban Agriculture Loss: Fertile farmland converted to urban sprawl; reduced local food production
Social/Environmental Justice
- Unequal Exposure: Pollution concentrated in low-income neighborhoods; minorities disproportionately affected
- Landfills/Refineries: Located near poor communities; health disparities
- Access to green space: Availability, quality, safety, shade and access often differ among neighbourhoods, with unequal health and recreation benefits. Analyse local evidence rather than assume every wealthy area has good access or every lower-income area lacks parks.
- Gentrification: Environmental improvements (parks, green spaces) can lead to rising property values; poor residents displaced
💡 Exam Tip: Urbanization = habitat loss (fragmentation, edge effects); stormwater runoff (pollution, flooding); air quality (emissions, heat islands); waste generation; environmental justice issues. Urban runoff is major nonpoint source pollution. Heat islands increase energy use and stress wildlife. Green infrastructure reduces runoff. Urban agriculture and green roofs help. Know sprawl vs. dense urban planning tradeoffs!
5.11 Ecological Footprints
Definition and Calculation
Ecological Footprint accounting estimates demand on biologically productive land and water needed to supply specified consumption and absorb associated carbon-dioxide emissions under its method. The unit is the global hectare (gha), an area standardized to world-average biological productivity. It is a useful biocapacity accounting framework, not a complete measure of biodiversity, toxicity, water scarcity or every waste stream.
Formula considerations: Food production, energy use, transportation, goods/services consumption, waste disposal
Key Facts
- National comparisons: Per-person footprints differ among countries and also within them. Country values require a named accounting edition and data year; an undated 8 gha value should not be treated as the present footprint of every American.
- Global mean: Calculate from a specified edition of the National Footprint and Biocapacity Accounts. Historical values such as 2.7 gha per person describe a particular accounting period, not a timeless global constant.
- Biocapacity: Productive area and productivity determine the account’s regenerative capacity. Per-person availability also changes with population. A classroom value of 1.6 gha per person can be used when given, but is not a universal ecological entitlement or a current estimate without a year.
- Overshoot ratio: Divide humanity’s Ecological Footprint by global biocapacity from the same accounting period. A value above one represents demand exceeding annual regeneration in this framework; it is not a literal number of replacement planets or a measure of all environmental damage.
- Variation: Rich nations have large footprints; poor nations have small footprints; global inequality
- Components: Cropland, grazing land, fishing grounds, forest products, built-up land and the carbon-uptake component. The carbon component is expressed as an equivalent sequestration-area demand; it is different from simply reporting tonnes of greenhouse gases.
Reducing Ecological Footprint
- Reduce consumption (buy less)
- Choose suitable lower-impact foods and reduce food waste. Production method and food type can matter more than transport distance alone; local production is not automatically lower-impact.
- Reduce energy use (renewable energy, efficiency)
- Use public transportation
- Recycle and reuse
- Support sustainable businesses
Exam tip: Use matching years, units and system boundaries for footprint and biocapacity. Explain what the accounting captures and what it omits. Ratios based on hypothetical numbers illustrate calculation; national averages do not describe every person or prove that one metric alone establishes sustainability.
Worked footprint and biocapacity ratios
Hypothetical data: If a consumption footprint is 4.0 gha per person and matching global biocapacity is 1.6 gha per person, The units cancel. If everyone had that consumption pattern under the same assumptions, demand would be 2.5 times annual biocapacity in the accounting system. This is a scenario, not a current country statistic.
Accounting identity:A national ecological deficit can be supported partly by imports, resource-stock depletion or carbon accumulation; it does not mean all environmental pressures occur within national borders. Compare the same account year and avoid adding gha directly to physical hectares or tonnes of carbon.
5.12 Introduction to Sustainability
Definition and Principles
Sustainability is the ability to meet present needs without compromising the ability of future generations to meet their needs. It requires balancing three interconnected systems: environmental protection, social equity, and economic prosperity (often called the "triple bottom line" or "three pillars").
Three Pillars of Sustainability
- Environmental (Planet): Protect ecosystems, biodiversity, air/water quality, climate stability; maintain renewable resources; manage waste responsibly
- Social (People): Ensure equity and justice; meet basic human needs (food, water, shelter, health, education); protect worker rights; respect cultural heritage; community participation in decisions
- Economic (Profit): Support livelihoods and prosperity; business viability; long-term economic growth; fair wages; financial stability without depleting resources
Key Sustainability Concepts
- Carrying capacity: The population or resource use supportable under specified conditions changes with resources, technology, consumption and ecological processes. It is not a single immutable number for every human society or a guarantee of support indefinitely.
- Renewal and depletion: Harvest relative to regeneration is a necessary resource-balance check, but sustainable use also protects habitat, age structure, water quality and social needs. Some aquifers recharge so slowly that they are effectively nonrenewable on human planning timescales. Recycling reduces demand for virgin minerals but cannot eliminate all losses.
- Planetary boundaries: A scientific framework evaluates nine Earth-system processes and associated risk boundaries, including climate, biosphere integrity and biogeochemical flows. Assessments indicate substantial human pressures across several processes. The boundaries describe risk and uncertainty rather than a precise universal tipping date; use a dated assessment for the number transgressed.
- Intergenerational Equity: Current generation has responsibility to leave resources/functioning ecosystems for future generations
- Intragenerational Equity: Fair distribution of resources among current population; addressing poverty and inequality
- Cradle-to-Cradle Thinking: Design products/systems for reuse/recycling (circular economy) rather than linear take-make-dispose model
- Precautionary Principle: When activity raises threat of harm, precautions should be taken even before cause-effect fully established
Paths to Sustainability
- Reduce Consumption: Voluntary simplification; challenging "more is better" mentality; slower, localized economies
- Renewable Energy Transition: Replace fossil fuels with solar, wind, geothermal, hydroelectric; essential for climate stability
- Circular economy: Design for durability, repair, reuse, recovery and recycling to reduce virgin material demand and waste. Real processes still require energy and lose materials; circularity does not literally eliminate all waste or extraction.
- Regenerative Practices: Go beyond "no harm"; actively restore/improve ecosystems (regenerative agriculture, forest restoration)
- Green Infrastructure: Nature-based solutions (wetlands, forests, green spaces) instead of gray infrastructure (concrete, pipes)
- Resilience and scale: Diverse local capacity can reduce some supply risks, while trade can also share resources and buffer local failures. Environmental performance depends on production, energy, storage and transport modes, not distance alone.
- Technology Innovation: Efficiency improvements, clean energy, carbon capture, alternative materials
- Policy and Governance: Carbon pricing, renewable energy mandates, conservation regulations, international agreements
Challenges to Achieving Sustainability
- Economic Incentives: Short-term profits often prioritized over long-term sustainability; externalities (pollution costs) not reflected in prices
- Population and Consumption: Growing population + rising per-capita consumption in developing nations strains resources
- Infrastructure Lock-in: Existing systems (fossil fuel energy, automobile-dependent cities) resistant to change; massive capital invested
- Political Inaction: Short election cycles; fossil fuel industry lobbying; lack of political will for difficult changes
- Inequality: Rich nations resist restricting consumption; poor nations rightfully claim right to develop; global cooperation difficult
- Tragedy of the Commons: Individual rational behavior leads to collective harm; difficult to regulate global commons (atmosphere, oceans)
Exam tip: Sustainability combines ecological limits, equitable outcomes and economic viability. A renewable-resource harvest should leave capacity for renewal and other ecological needs, with allowance for uncertainty. Use measurable indicators and trade-offs rather than assume a circular, local or regenerative label guarantees a sustainable result.
5.13 Methods to Reduce Urban Runoff
Understanding Urban Runoff
Urban runoff is precipitation that flows over impervious surfaces (roads, roofs, parking lots) directly into storm drains and waterways. Rapid, concentrated runoff causes flooding, stream erosion, and carries pollutants (oils, heavy metals, sediments, fertilizers) into aquatic ecosystems. Green infrastructure mimics natural water infiltration and filtering.
Green Infrastructure Technologies
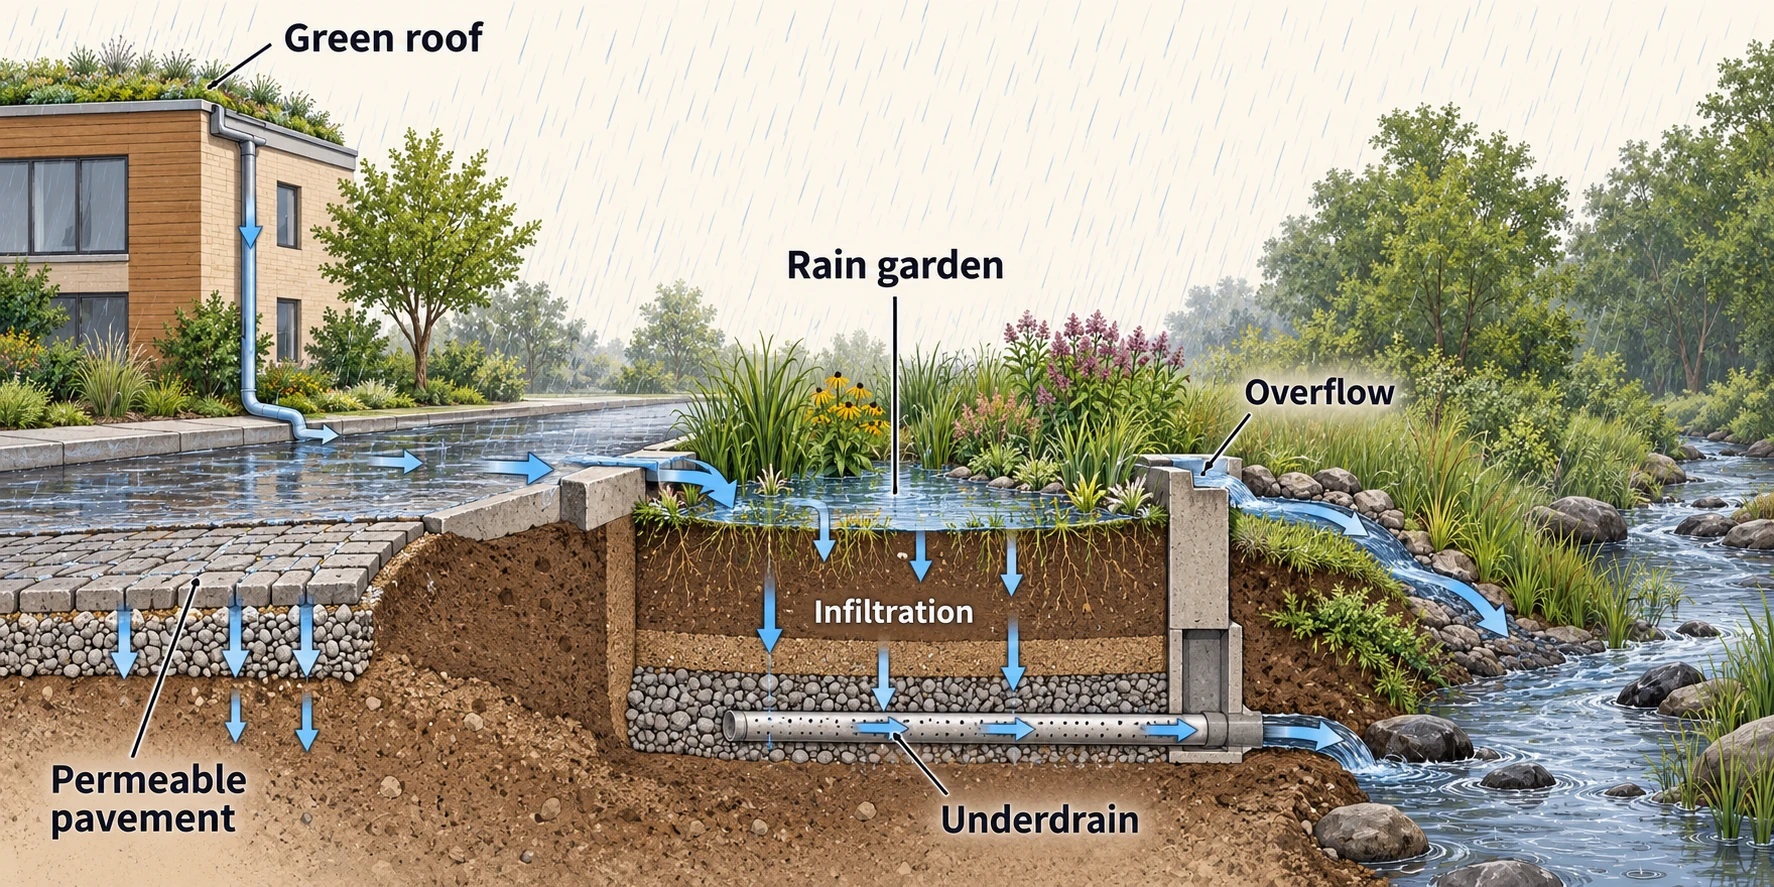
1. Green Roofs (Living Roofs)
- System: A living roof stores water in vegetation and growing medium. Retention varies with substrate depth, plants, antecedent moisture, storm size and climate; 40–80% is not a guaranteed annual or per-storm outcome.
- How it works: Vegetation intercepts rainfall; soil stores water; excess slowly drains or evaporates
- Co-benefits: Shading, evapotranspiration and insulation can moderate roof temperatures and energy demand, depending on building design and climate. Habitat, roof life and amenity can improve; a fixed 20–30% HVAC saving is not universal.
- Constraints: Structural load, waterproofing, installation, irrigation where needed and long-term maintenance affect feasibility and life-cycle cost. Prices vary by place, date and design; do not use a universal dollar-per-square-foot figure.
- Best for: Commercial buildings, apartment complexes; cities with significant rainfall
2. Rain Gardens and Bioswales
- System: Shallow, depressed gardens designed to capture and filter stormwater runoff; planted with water-tolerant native plants
- How it works: Runoff collects in depression; infiltrates through soil layers; vegetation roots and soil microbes filter pollutants; excess water either infiltrates to groundwater or slowly drains
- Potential benefits: Bioretention can slow runoff, retain sediment and remove some pollutants through filtration, sorption, uptake and microbial processes. Removal differs by pollutant and design; it is not automatically 90% or more for all contaminants. Groundwater recharge occurs only where infiltration is suitable.
- Challenges: Requires space; needs proper soil; may attract mosquitoes if poorly maintained; requires plant selection for local climate
- Best for: Residential properties, parking lots, street medians; anywhere runoff accumulates
3. Permeable/Porous Pavement
- System: Road, parking lot, or walkway surfaces that allow water infiltration through material; water drains into underlying reservoir and soil
- Types: Permeable concrete, porous asphalt, pervious pavers, grid pavers with grass infill
- How it works: Water passes through surface voids; underlying gravel/sand filters pollutants; water percolates to groundwater or is stored in base layer
- Potential benefits: Permeable surfaces can reduce runoff and ponding within their design capacity. Larger storms, clogging or saturated subsoil can still cause overflow. Recharge, temperature and acoustic effects depend on the system; water absorbing sound is not a general explanation of pavement noise reduction.
- Constraints: Cost, loading, infiltration suitability, clogging and sediment maintenance matter. Appropriate design can work in cold climates; freeze–thaw performance is not determined by permeability alone.
- Best for: Parking lots, sidewalks, low-traffic roads, residential areas
4. Constructed Wetlands
- System: Engineered wetlands built to treat stormwater; shallow ponds/marshes with vegetation, gravel, soil
- How it works: Stormwater flows slowly through wetland; plants and soil organisms filter/degrade pollutants; long residence time allows settling of sediments; denitrification reduces nitrogen
- Potential benefits: Constructed wetlands slow flow and can retain sediment, transform nutrients and provide habitat. Performance varies with loading, residence time, season and maintenance. They are not guaranteed to remove 90% of every pollutant or withstand every extreme event.
- Challenges: Requires significant land area (not available everywhere); mosquito management; regular maintenance
- Best for: Industrial sites, large commercial properties, parks, areas with dedicated land
5. Stormwater Detention/Retention Ponds
- Detention: Temporary storage basin; water held for hours to days; then released to waterways
- Wet retention pond: Commonly includes a permanent pool with additional storm storage and an outlet; stored water can be discharged, infiltrated or evaporated. Terminology varies by jurisdiction. A permanent pool does not mean all incoming water remains indefinitely.
- How it works: During storms, runoff diverted to basin; slows flow; sediments settle; pollutants adsorb to soil particles; reduces peak flows downstream
- Potential benefits: Storage and controlled release can reduce peak flows for design events and encourage sediment settling. Flooding can still occur during larger storms or poor maintenance; removal is generally pollutant-specific, and dissolved contaminants can remain.
- Challenges: Requires land; mosquito breeding potential; sediment accumulation requires maintenance; may not remove all pollutants
- Best for: Parking lots, residential subdivisions, commercial areas; standard practice in many jurisdictions
6. Street Trees and Urban Forests
- System: Urban trees intercept some rainfall and promote evapotranspiration, shade and soil infiltration where root zones allow. Interception varies with canopy, season and storm; no single 10–40% interception or 20–50% runoff reduction applies to every street.
- How it works: Tree canopy intercepts 10-40% of rainfall during storms; water stored on leaves and evaporates; infiltration through root zone; reduced runoff 20-50%
- Co-benefits: Reduces heat island effect (shade, evapotranspiration); air quality improvement; carbon sequestration; wildlife habitat; property value increase; mental health/recreation
- Challenges: Slow to establish (years to mature); requires irrigation initially; compacted soil reduces root growth; damage from construction/pollution
- Best for: All urban areas; especially streets, parks, schoolyards
Integrated Approach to Urban Stormwater Management
Best practice: Combine multiple green infrastructure techniques at landscape scale to manage stormwater holistically. "Sponge cities" concept - make cities permeable, resilient to flooding.
Multi-Level Approach:
- Building Level: Green roofs, downspout rain barrels, rain gardens in yards
- Street/Block Level: Permeable pavements, street trees, bioswales, pocket parks
- Neighborhood/Watershed Level: Detention/retention basins, constructed wetlands, riparian restoration
- City Level: Urban forest strategy, green infrastructure standards, financing mechanisms
- Regional Level: Watershed-based stormwater planning, agricultural best management practices
Exam tip: Match each practice to its flow path and design capacity. Green roofs store some water, bioretention treats and slows runoff, permeable pavement routes water through a base layer, and ponds manage storage and release. Include maintenance, overflow and groundwater-protection constraints rather than assume complete flood or pollution removal.
Worked stormwater volume and reduction
Scenario: A 25 mm storm falls uniformly on a 10,000 site. Use and the simplified event relation where C is a given dimensionless runoff fraction, P is rainfall depth and A is area. With a conventional-site C of 0.90, If a stated design reduces C to 0.50 for the same storm, runoff is 125 and the volume reduction is Do not interpret this as a universal removal percentage or a peak-flow calculation. Peak flow also depends on timing, storage, rainfall intensity and drainage connections.
5.14 Integrated Pest Management (IPM)
Definition and Philosophy
Integrated Pest Management (IPM) uses prevention, pest identification, monitoring and evidence-based decisions to reduce unacceptable pest damage with appropriate combinations of cultural, physical, biological and chemical options. Pesticides can be a targeted part of the plan when justified; IPM is not a rule that every nonchemical method must fail first regardless of urgency or risk.
Key philosophy: Manage pests, don't eradicate them. Some pest presence acceptable if economic damage threshold not exceeded.
Core IPM Principles and Components
1. Monitoring and Thresholds
- Monitor pest populations: Regular scouting to count/identify pests and beneficial insects
- Economic injury level: The pest density at which expected economic loss equals the cost of control under stated conditions. This is different from the earlier action or economic threshold used to trigger intervention before injury reaches that level.
- Action or economic threshold: The point at which action is indicated to prevent unacceptable damage. In crop economics it is often set below the economic injury level, allowing for pest growth and treatment delay. Thresholds can also reflect health, conservation or aesthetic goals.
- Decision Tools: Degree-day models, weather data, pest traps help predict pest emergence and timing of controls
- Benefit: Monitoring and thresholds can avoid unnecessary intervention and protect natural enemies. Costs and reductions in pesticide use depend on the crop, pest and baseline system; a universal 30–50% saving is not assured.
2. Cultural and physical prevention options
- Crop Rotation: Alternating different crops breaks pest life cycles; pests adapted to specific crops can't survive if crop changes
- Sanitation: Remove plant debris, fallen fruit, weeds that harbor pests; sterilize tools to prevent disease spread
- Resistant Varieties: Plant crop varieties with genetic resistance/tolerance to pests and diseases
- Timing: Plant/harvest dates adjusted to avoid pest emergence; example: early planting escapes late-season pest pressure
- Spacing and Density: Proper plant spacing improves air circulation; reduces disease; facilitates pest management
- Trap Crops: Plant sacrificial crops that attract pests away from main crop; pests concentrate on trap crop instead
- Mechanical: Hand-picking, row covers (prevent insect access), traps, barriers, pruning infested branches
3. Biological controls and natural enemies
- Natural Enemies: Introduce predators, parasites, or pathogens that feed on target pests
- Examples: Ladybirds and spiders can prey on pests; parasitoid wasps develop in specific hosts. Bt products contain toxins effective against particular susceptible insects. Rates of predation and host specificity vary; avoid a fixed daily aphid count for every ladybird.
- Conservation Biocontrol: Protect/encourage existing beneficial insects; minimize pesticide use (kills beneficials too); provide habitat (flowering plants, water)
- Potential advantages: Natural enemies can provide continuing pest suppression and reduce some pesticide applications. Establishment, specificity and cost vary. Introduced agents require assessment for non-target effects; biological origin does not guarantee safety or permanent control.
- Disadvantages: Slower action than chemicals; may not completely eliminate pest; biological control can fail if natural enemies themselves decline
- Resistance management: Diverse tactics can reduce selection from repeated reliance on one mechanism. Pests can adapt to biological agents or Bt toxins as well as synthetic products, so monitoring and resistance planning remain necessary.
4. Targeted chemical controls when justified
- Selection: Choose an effective option with the lowest suitable overall risk for the target, setting and urgency. Consider selectivity, exposure, persistence and effects on natural enemies. Targeted pesticides can be justified before a slower tactic has time to work.
- Origin is not a safety ranking: Neem, soaps, sulfur and pyrethrins have different hazards and uses. Organic approval, natural origin and a narrow spectrum are not interchangeable with harmlessness. Assess the product, exposure and local requirements.
- Application Timing: Apply pesticides only when threshold reached; use proper timing to catch vulnerable pest life stage (e.g., spray when eggs hatch)
- Mode-of-action rotation: Alternating effective modes of action, conserving natural enemies and following resistance-management plans can delay resistance. Changing brand names alone may not change the active mechanism, and no rotation guarantees resistance will never evolve.
- Precision: Apply only to affected areas; avoid drift to non-target areas; use rates recommended on label
- Safety: Follow label directions; use protective equipment; avoid applicator exposure and nontarget damage
- Documentation: Record all pesticide applications (date, product, rate, target); helps identify patterns and resistance issues
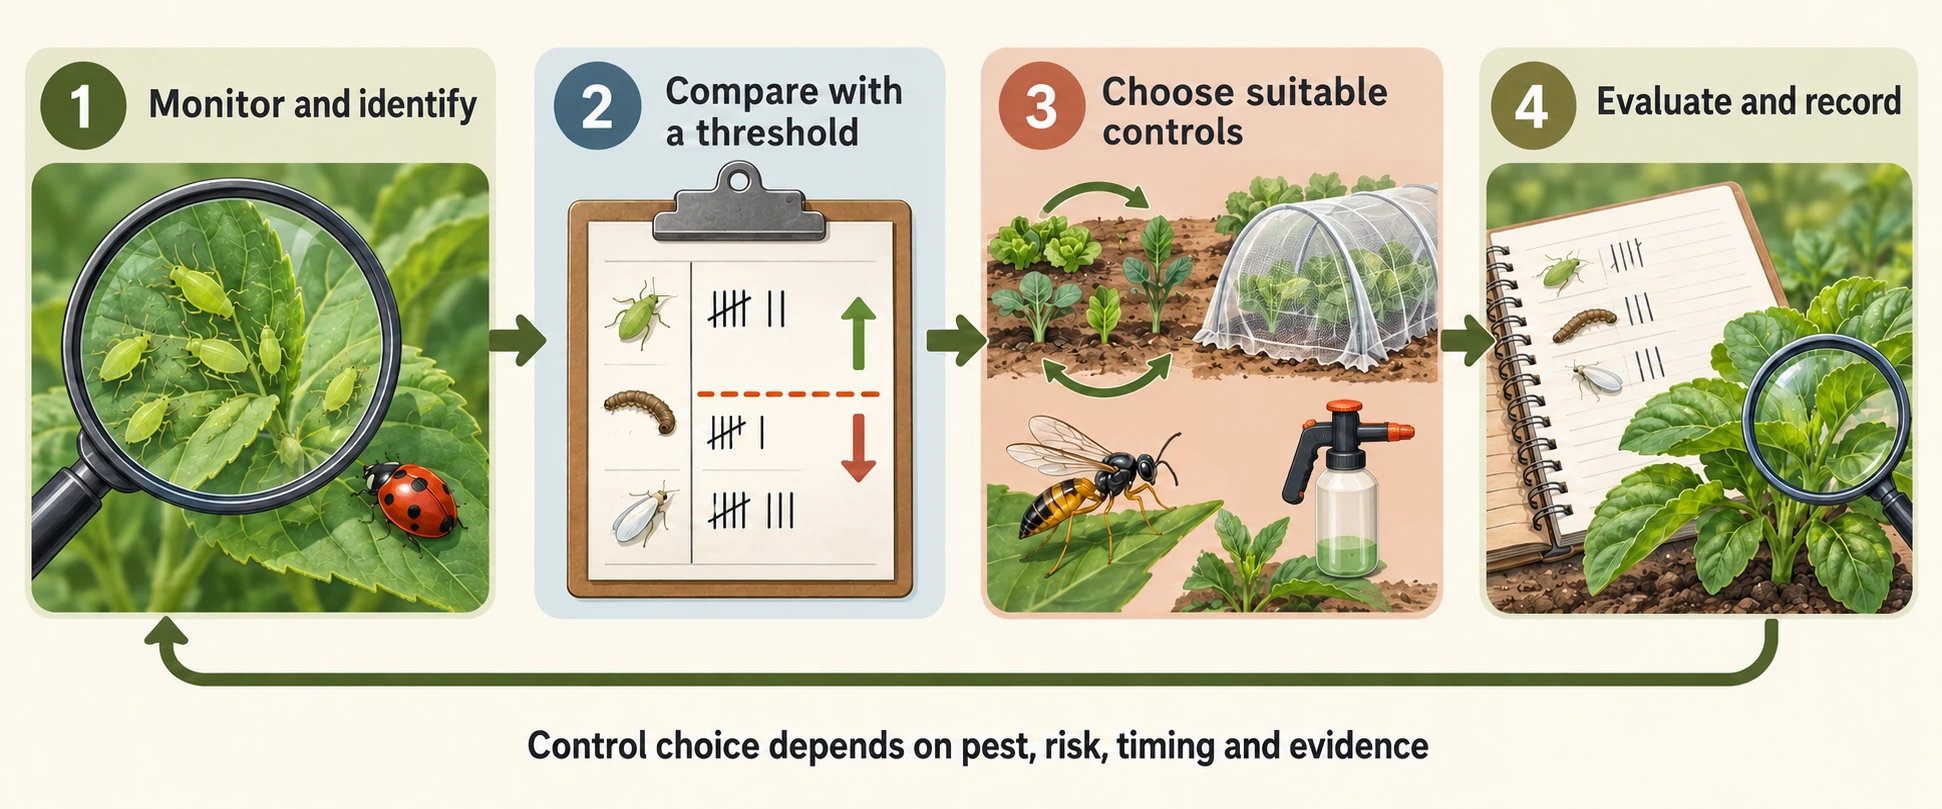
IPM Decision Framework (Sequential Decision Making)
- Step 1: Scout and Monitor - Identify pests, count populations, assess damage
- Step 2: Compare to Threshold - Is pest population above action/economic threshold?
- Step 3: If Below Threshold - Continue monitoring; no action needed; pest populations naturally fluctuate
- Step 4: If intervention is justified — choose and combine suitable options based on pest identity, thresholds, effectiveness, urgency and risk:
- a) Consider prevention and cultural or physical options suitable for the identified pest; do not assume the same tactic is always easiest, cheapest or safest.
- b) Biological controls if available and effective
- c) Include targeted chemical treatment when monitoring, thresholds and risk assessment justify it; timing and integration matter more than a rigid failure-first ladder.
- Step 5: Evaluate Effectiveness - Did population drop below threshold? Adjust strategy if needed
Benefits of IPM vs. Chemical-Only Approach
| Factor | IPM Approach | Chemical-Only |
|---|---|---|
| Pesticide Use | Context-dependent; avoids unnecessary applications | Repeated chemical control in this comparison |
| Resistance Development | Can delay resistance; still needs monitoring | Repeated single-mode selection raises risk |
| Cost | Depends on scouting, intervention and avoided losses | Variable (depends on pest) |
| Beneficial Insects | Can conserve natural enemies; outcomes vary | Non-target risk varies by product and exposure |
| Pollinator Health | Potentially lower exposure with suitable practices | Risk depends on compound, dose and exposure |
| Applicator Health | Can reduce exposure; precautions still required | Higher risk |
| Environmental Pollution | Reduced | High |
| Long-term Sustainability | Requires continuing evaluation | Repeated reliance can create environmental and resistance risks |
Exam tip: Separate the action threshold from the economic injury level. Identify the pest, assess risk, choose an appropriate combination, evaluate results and continue monitoring. IPM can reduce unnecessary pesticide use and delay resistance, but savings, costs and safety benefits must be demonstrated for the particular system.
Worked threshold decision
A hypothetical treatment costs 30 currency units per hectare and is expected to prevent 50 units per hectare of crop loss. Its expected net economic benefit is A positive expected value is one input to the decision, not an instruction to spray. Confirm pest identity, treatment effectiveness, natural enemies, timing, risks and any relevant requirements. If the expected avoided loss were only 20, the same 30-unit treatment would have a negative expected direct return. Monitoring and prevention can still continue below an intervention threshold.
5.15 Sustainable Agriculture
Definition and Goals
Sustainable agriculture integrates environmental, social, and economic goals to produce sufficient food/fiber indefinitely while maintaining soil health, water quality, biodiversity, and farmer viability. It moves away from exploitative linear models toward regenerative practices that restore ecosystem functions.
Goals of Sustainable Agriculture
- Environmental: Protect soil, water, air; maintain biodiversity; reduce chemical inputs; sequester carbon; adapt to climate change
- Economic: Ensure profitability; reduce input costs; diversify income streams; fair prices for farmers; viability for multi-generational farms
- Social: Fair labor practices; safe working conditions; support rural communities; food security; cultural preservation
- Food Production: Sufficient yields to feed population; nutrient-dense food; reduced food waste
Key Sustainable Practices
1. Crop Rotation
- System: Plant different crops in sequence (Year 1: corn, Year 2: soybeans, Year 3: wheat, Year 4: hay/clover)
- Benefits: Symbiotic microbes associated with legumes fix atmospheric nitrogen. Rotations can disrupt some pest cycles and diversify roots; nitrogen available to a following crop depends on fixation, harvest removal and residue decomposition. The legume does not supply unlimited immediate nitrogen to every neighbouring crop.
- Challenges: Requires planning; less intensive land use than monocultures; market uncertainty
- Result: Well-planned rotations can reduce fertilizer needs and some pest pressures, but savings vary with crop sequence, soil and nutrient budget. A universal 50–70% reduction is not a defining property of rotation.
2. Cover Crops
- System: Plant vegetation (legumes, grains, grasses) during off-season when main crop absent
- Benefits: Prevents erosion; adds organic matter; nitrogen fixation (legumes); breaks pest cycles; improves water infiltration; reduces weeds
- Examples: Winter rye, clover, alfalfa, hairy vetch
- Cost: Seed cost low; reduces need for synthetic fertilizer/erosion control
3. Reduced/No-Till Farming
- System: Minimize or eliminate soil tilling; leave crop residue in place; plant new crop directly into previous crop residue
- Benefits: Prevents soil erosion; maintains soil structure; preserves soil organisms; reduces fuel/labor; sequesters more carbon; retains soil moisture
- Challenges: Requires specialized equipment; initial learning curve; relies more on cover crops/herbicides (may offset some sustainability gains if herbicide-heavy)
- Result: Reduced disturbance with protective cover often reduces erosion and fuel use. Soil-carbon change, yields and weed pressure vary with climate, soil, depth sampled and duration; no-till is not a guarantee of a fixed 90% reduction or permanent carbon storage.
4. Agroforestry
- System: Integrate appropriate trees with crops or livestock for shade, wind protection, products and habitat. Some tree species associate with nitrogen-fixing microbes; most trees do not fix nitrogen simply because they are trees.
- Examples: Alley cropping (rows of trees with crops between); silvopasture (trees in pastures for shade); forest farming (shade-tolerant crops under tree canopy)
- Benefits: Diversified income (timber, nuts, fruit, crops); improved microclimate; increased biodiversity; soil improvement; resilience to climate extremes
- Challenges: Long-term investment; complex management; initial productivity loss while trees establish
5. Organic Farming
- System: USDA organic production follows specific standards, including restrictions on most synthetic pesticides and fertilizers and on genetic engineering. Some synthetic substances are allowed and some natural substances prohibited. Livestock rules are distinct; organic does not mean chemical-free.
- Potential benefits: Organic systems can support soil management and biodiversity and reduce use of certain inputs. Environmental effects, residues and occupational exposure depend on practices and products; certification does not guarantee zero residues, greater carbon storage or harmless pest control.
- Challenges: Organic yields can be lower than comparable conventional yields, but the gap varies by crop, region and management; 10–20% is not a fixed rule. Labour, certification and input costs can be higher, while profitability depends on yield, costs, markets and any price premium.
- Certification: USDA organic certification verifies compliance with its production and handling standards, including its National List of allowed and prohibited substances. It is not a guarantee that no synthetic substance was used or that every product commands a fixed price premium.
- Markets: Demand and price premiums differ among products, regions and years. Certification, labour, yield and access to markets influence viability; avoid an undated claim that organic is always the fastest-growing sector.
6. Polyculture (Multiple Crops)
- System: Grow multiple crops together instead of monocultures; intercrops provide complementary benefits
- Examples: "Three sisters" - corn + beans + squash (nitrogen fixation, support, ground cover); alley cropping; multistory cropping
- Benefits: Pest/disease suppression (diversity confuses pests); improved soil fertility (legumes + others); efficient resource use; food diversity; resilience
- Challenges: More complex management; markets designed for monocultures; harvest/processing more difficult
- Result: More biodiverse, resilient, stable farms mimicking natural ecosystems
7. Precision Agriculture (Site-Specific Management)
- System: Use GPS, drones, sensors, and data analysis to apply inputs (water, fertilizer, pesticides) precisely where needed
- Potential benefits: Site-specific application can reduce unnecessary inputs and improve timing where data and equipment are useful. Results depend on spatial variability, calibration, management and costs; efficiency gains alone do not ensure lower total resource use.
- Technologies: Variable rate application, drone monitoring, soil sensors, weather integration
- Challenge: High initial cost; requires tech expertise; data privacy concerns
Sustainable Approaches: Broader Context
- Regenerative Agriculture: Goes beyond sustainability to actively restore soil health, increase carbon, improve biodiversity (composting, minimal disturbance, diverse rotations)
- Farm Diversification: Multiple products (crops, livestock, agritourism) spread economic risk; reduce monoculture vulnerability
- Local food systems: Farmers’ markets and community-supported agriculture can strengthen producer–consumer ties and local livelihoods. Climate impacts also depend on food type, production, storage, waste and transport mode; shorter distance alone is not a complete footprint comparison.
- Soil Health: Central to all sustainable approaches; healthy soil produces healthy food, sequesters carbon, retains water, supports biodiversity
- Adaptive Management: Monitor results; adjust practices based on outcomes; continuous improvement
Exam tip: Explain mechanisms and trade-offs for rotations, cover crops, reduced tillage, agroforestry, organic standards, intercropping and precision management. Measure outcomes such as erosion, nutrient balance, yield, profitability and biodiversity. Labels and fixed percentage savings should not replace evidence.
Worked production and erosion comparisons
Yield: A farm harvests 600 tonnes from 100 hectares, giving A higher total harvest from a larger planted area does not necessarily mean yield increased.
Erosion: Under comparable measurements, reducing annual soil loss from 12 to 3 tonnes per hectare gives reduction. The result belongs to that comparison; crop cover, slope, storms and measurement method must be considered before transferring it to another field.
5.16 Aquaculture
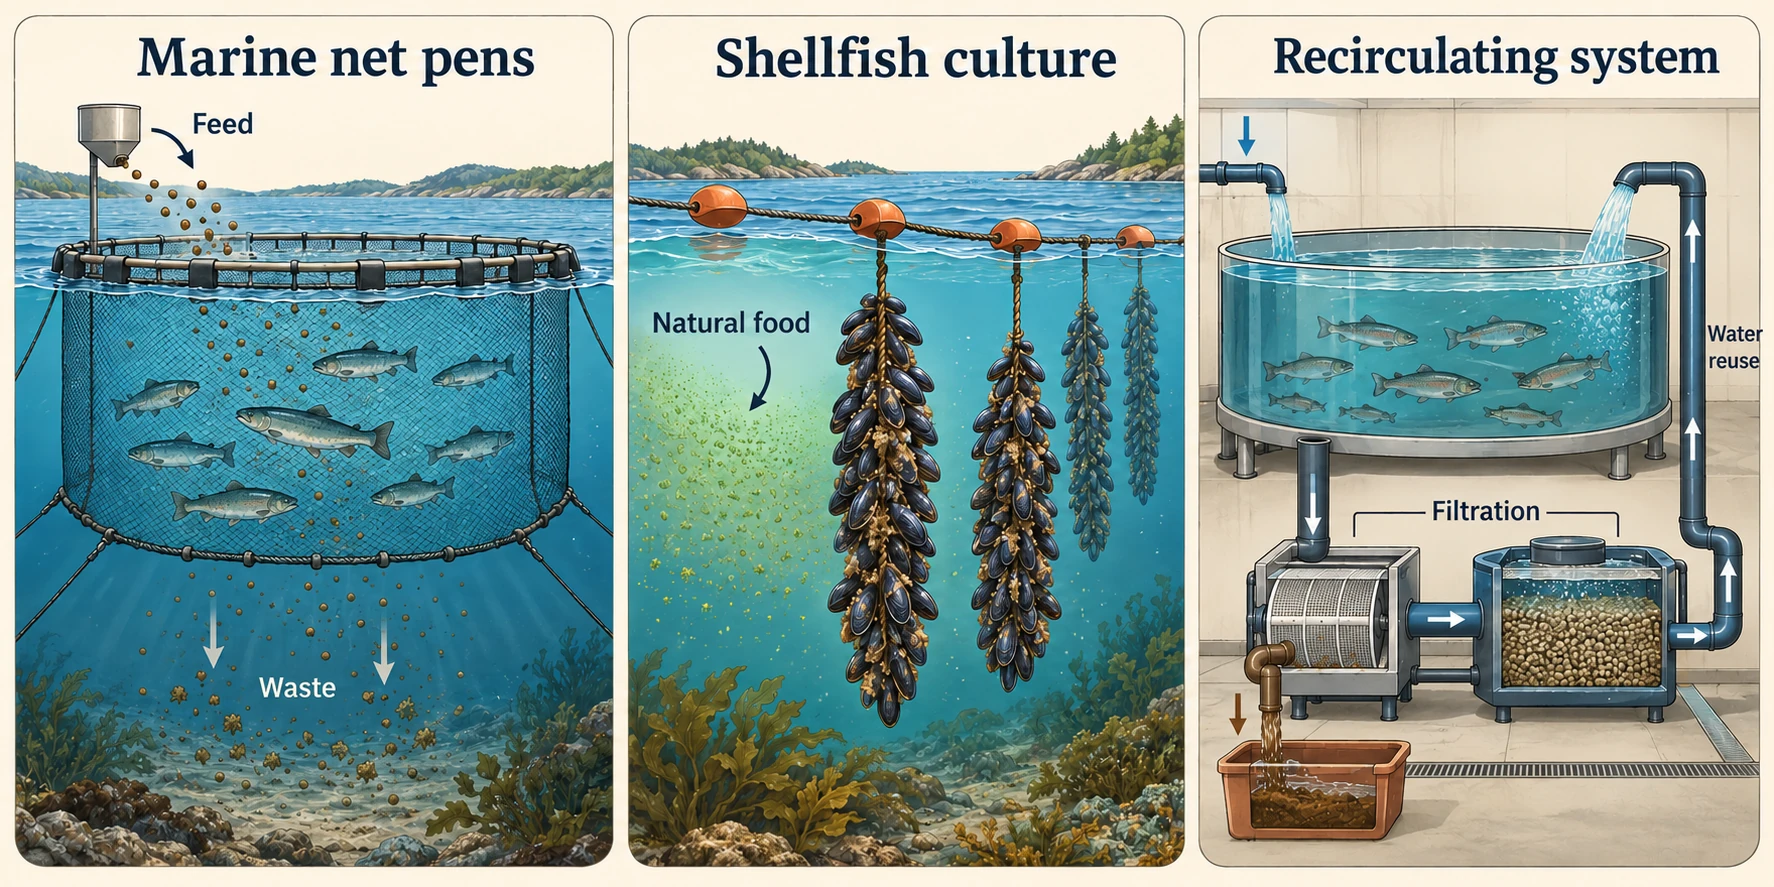
Definition and Overview
Aquaculture is farming aquatic animals and plants in ponds, tanks, raceways, cages or other managed systems. FAO’s 2024 SOFIA report records 94.4 million tonnes of farmed aquatic animals in 2022, about 51% of total aquatic-animal production. This dated production share is different from all seafood consumed by people, and growth rates vary by species, region and period.
Types of Aquaculture
- Freshwater systems: Ponds, tanks and raceways can produce carp, tilapia or catfish; salmon also have freshwater hatchery stages. Impact depends on water use, discharge, feed and management, not simply freshwater being lower-impact than every marine system.
- Marine Aquaculture: Cages/pens in coastal waters; salmon, sea bass, shrimp, oysters; higher impact on marine ecosystems
- Integrated Multi-Trophic Aquaculture (IMTA): Combination of fish, shellfish, seaweed; waste from one species feeds another; more sustainable
- Recirculating systems: Treatment and reuse can reduce water exchange and contain wastes, but require make-up water, energy and sludge or effluent management. They are not closed, impact-free systems.
Advantages of Aquaculture
- Food supply and wild stocks: Aquaculture can add production and substitute for some wild catch. Outcomes depend on feed ingredients, markets and management; farming does not automatically prevent overfishing or eliminate wild-fish demand.
- Feed efficiency: Some farmed aquatic species have favourable feed conversion under stated conditions, while shellfish often use natural food. Specify species, feed basis, live-weight gain and edible yield before comparing with cattle or other livestock; a single ratio does not establish sustainability.
- Food Security: Produces protein in quantity needed for growing human population; makes seafood accessible to more people
- Economic Development: Job creation in coastal/rural areas; export income for developing nations; farmer profitability
- Production control: Hatcheries and managed systems can improve scheduling and consistency. Many farms still depend on seasonal temperature, oxygen, water availability and weather; production is not universally independent of seasons.
- Research Opportunities: Selective breeding for disease resistance, growth rate, feed efficiency
Environmental Disadvantages of Aquaculture
Waste, nutrients and receiving-water capacity
- Waste: Uneaten feed and faeces can accumulate beneath net pens and increase oxygen demand. Effects depend on stocking, feed management, depth, currents and benthic sensitivity; dead zones are a possible impact, not a necessary result at every farm.
- Nutrient Eutrophication: Excess nitrogen/phosphorus causes algal blooms in surrounding waters; oxygen depletion; aquatic life die-offs
- Sediment Buildup: Organic matter accumulates under farm cages; smothers benthic communities; harmful bacteria proliferate
- Coastal Impact: Nearshore farms have highest impact; some regions restrict expansion due to pollution concerns
Escapes and Invasiveness
- Cage Breaches: Farm fish escape during storms, accidents, or deliberate release; establish in wild populations
- Genetic Contamination: Escaped farmed fish interbreed with wild relatives; introduce farmed genetics (weaker adaptation to wild conditions)
- Competition/Predation: Escaped fish compete with wild fish for food/habitat; may predate on native species
- Examples: Atlantic salmon farms in Pacific cause ecological disruption; farmed tilapia become invasive in many regions
- Escape management: Suitable containment, inspections and contingency plans reduce escapes. Sterile stocks can reduce reproductive risk where appropriate, but do not prevent escape, competition, disease transmission or every ecological effect.
Disease and Parasite Pressure
- Crowding Stress: High stocking densities stress fish; reduce immunity; increase disease susceptibility
- Sea lice: These parasites can infest farmed and wild salmonids. Risks depend on parasite abundance, migration routes, farm density and management; not every contact causes high mortality, and effects require site-specific evidence.
- Antibiotic Use: Antibiotics administered to treat/prevent disease; resistance develops; residues in environment; affects wild microbiomes
- Pathogen Spread: Diseases/parasites can transmit from farms to wild populations through water movement
- Solution: Better farm hygiene, selective breeding for disease resistance, reduce stocking density
Feed Requirements
- Feed conversion ratio: Feed input divided by animal live-mass gain over a specified interval. Values differ by species, stage, feed moisture and management; lower ratios can reduce feed demand without capturing every environmental impact.
- Fish Meal/Oil: Many farms use fish meal (ground wild-caught fish) and fish oil; perpetuates fishery pressure on wild stocks
- Wild feed ingredients: Some diets use fishmeal and fish oil from directed fisheries or processing by-products. Requirements and substitution have changed; a fixed count of two or three wild fish per farmed fish is not a meaningful universal measure.
- Alternative feeds: Plant, algal, microbial and other ingredients can reduce reliance on some marine inputs, with nutritional and land-use trade-offs. Bivalves generally need no added feed, while farmed herbivorous or omnivorous fish can still receive formulated diets.
- Innovation: Algal oils, microbial proteins and improved feed formulation can substitute for some marine ingredients. Compare nutrition, energy, cost and life-cycle effects rather than assume a laboratory-grown input has no resource footprint.
Making Aquaculture More Sustainable
- Bivalve culture: Mussels and oysters commonly filter natural food without added feed. They can provide services but also produce biodeposits, alter habitats and face carrying-capacity limits; environmental effects depend on stocking and location.
- Integrated Multi-Trophic Aquaculture: Combine fish with seaweed, shellfish; waste products utilized; mimics ecosystem functions
- Recirculation: Water reuse and treatment can reduce discharge and escape risk while concentrating wastes for management. Energy demand, water sourcing and sludge handling remain important; pollution and escapes are not automatically eliminated.
- Certification: Programmes such as the Aquaculture Stewardship Council assess compliance with specified standards. Verify the scope and requirements of a claim; certification can support informed choices without guaranteeing zero environmental impacts.
- Species and diets: Tilapia and carp can often use diets with less reliance on marine ingredients than some carnivorous fish, but many farms still use formulated feeds. Compare actual feed sources, farming systems and local impacts rather than rank sustainability from feeding category alone.
- Offshore sites: Currents can disperse wastes and reduce local accumulation, but dilution does not remove total nutrient inputs. Storm exposure, monitoring, sensitive habitats and connectivity to wild populations must also be assessed.
Exam tip: Compare species, system, feed, energy, waste, disease and escape risks. Net pens, ponds, shellfish culture and recirculating facilities have different trade-offs. Certification can verify specified practices, but no production label proves zero impacts or automatically solves overfishing.
Worked feed conversion and system boundaries
A hypothetical farm uses 1,800 kg of dry feed while fish live mass increases by 1,200 kg over the same period. Using that explicitly stated convention, That is 1.5 kg of dry feed per kg of live-mass gain. Do not compare it directly with a ratio based on edible fillet, carcass mass or wet feed. Feed origin, energy, mortality, water quality and escapes remain outside this simple ratio.
Follow the waste: A mechanical filter removes solids; a biofilter commonly converts ammonia through microbial processes rather than making all nitrogen disappear. Sludge and dissolved nutrients still need management, while pumping and aeration use energy. In integrated systems, nutrient uptake by other organisms can help but must match actual loading and harvest.
5.17 Sustainable Forestry
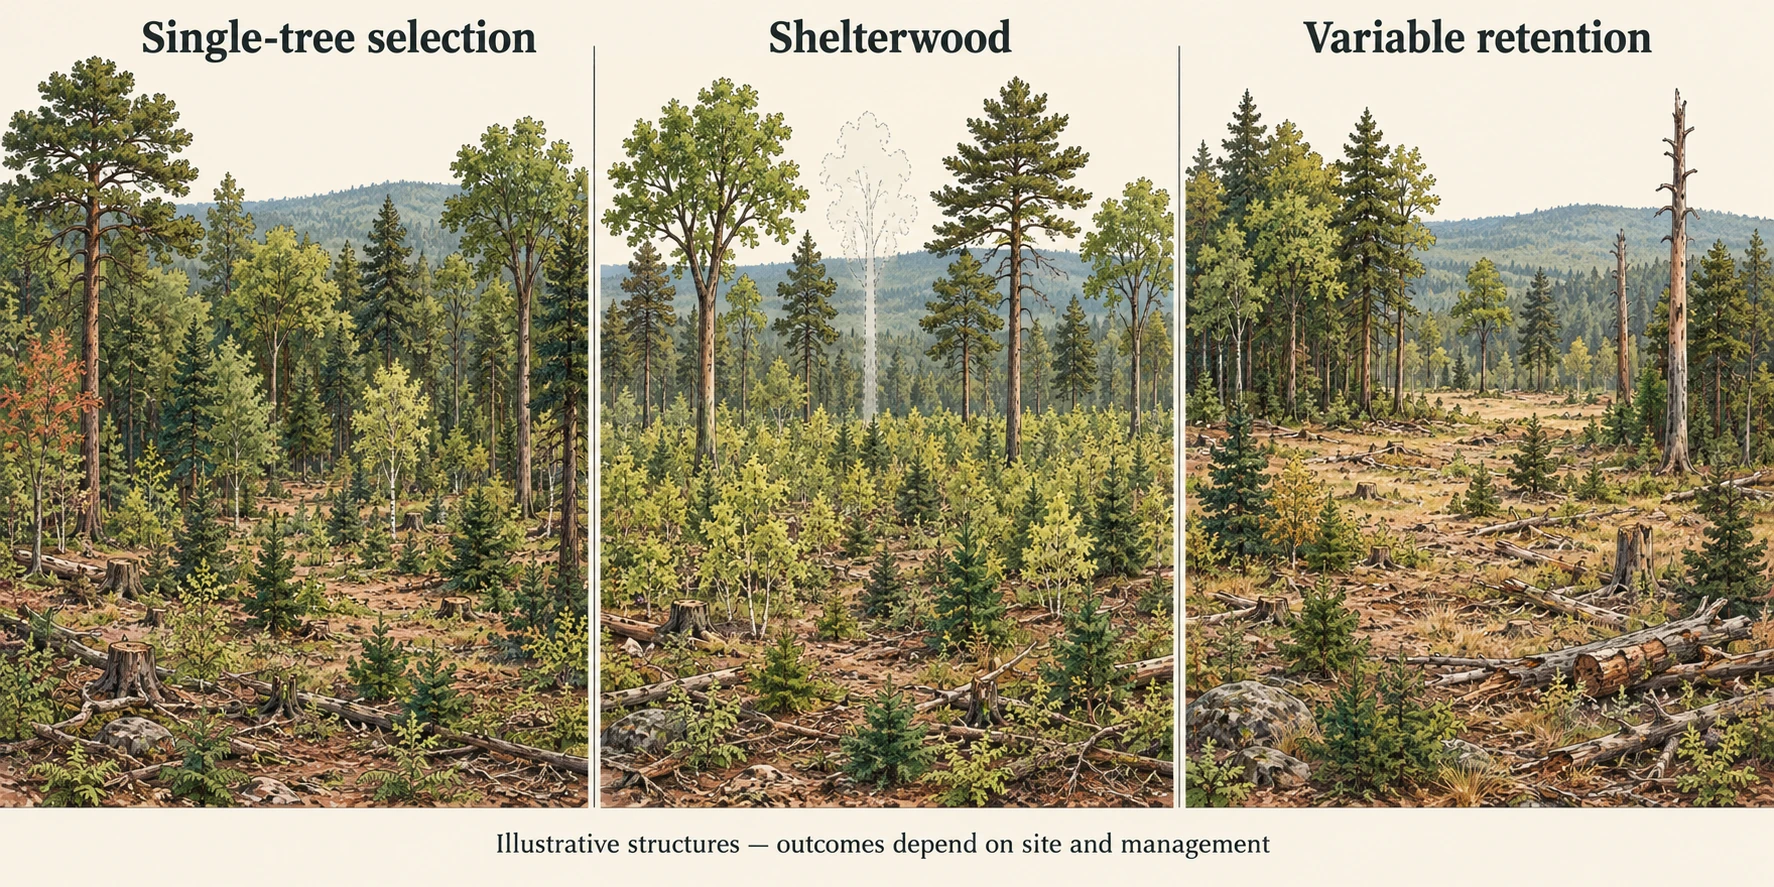
Definition and Principles
Sustainable forestry, also called responsible forestry or forest stewardship, aims to meet timber needs while maintaining ecosystem functions, biodiversity and social values over time. Harvest must be compatible with regeneration and net growth after other losses, but volume balance alone does not guarantee habitat, water or carbon protection.
Core Principles of Sustainable Forestry
- Resource balance: Harvest should remain compatible with net growth after mortality and other losses. Maintaining timber volume alone does not prove protection of habitat, carbon stocks, water or community rights; include uncertainty and landscape-scale effects.
- Ecosystem Function: Maintain forest structure, microhabitats, soil health, water cycles; don't just count board feet of timber
- Biodiversity Protection: Preserve species habitat requirements; protect old-growth characteristics where possible
- Long-term Perspective: Manage for perpetual productivity; think in terms of generations, not quarterly profits
- Community Benefits: Support rural livelihoods; meet local needs (firewood, medicine); respect indigenous rights
- Adaptive Management: Monitor outcomes; adjust practices based on results
Sustainable Harvest Methods
1. Selective Cutting
- System: Remove individual trees or small groups; maintains forest canopy continuity and structural complexity
- Selection prescription: Retain appropriate species, size classes and habitat structures while regenerating desired trees. Removing only the most valuable trees without attention to future stand condition is high-grading, not automatically sustainable selection forestry.
- Potential benefits: Selection can retain more continuous canopy, habitat structure and some ecosystem services while providing repeated harvests. Erosion, flooding and biodiversity outcomes depend on roads, soil disturbance, removal intensity and the species concerned.
- Challenges: More expensive than clearcutting (selective labor); lower timber volume per harvest; requires skilled workers; market bias toward clear timber from clearcutting
- Cutting cycle: The proportion removed and return interval depend on forest growth, species, stocking, objectives and disturbance. A universal 25–50% removal every 20–40 years should not replace a site-specific plan.
2. Shelterwood Cutting
- Shelterwood: Retain part of the overstory temporarily while establishing a new cohort, then remove further shelter trees as regeneration succeeds. Number and timing of entries vary; shelterwood generally creates a new largely even-aged stand rather than permanent uneven-aged structure.
- Sequence: Preparatory or establishment cuts retain suitable shelter trees while a new cohort develops. Further removal cuts release established regeneration. The number of cuts, remaining canopy and timing depend on species, seed supply and site; a fixed 40-60% canopy is only an example.
- Benefits: Maintains canopy shade; promotes natural regeneration; reduces erosion; preserves habitat during transition; protects soil from extreme conditions
- Challenges: Longer rotation; complex logistics; requires careful planning and skilled management
- Outcome: Temporary shelter can support regeneration and buffer conditions for some species. Later removal changes habitat again; improved resilience or biodiversity relative to another prescription must be assessed rather than assumed.
3. Variable Retention Harvesting
- Variable retention: Retain selected trees, groups, snags or downed wood to carry biological legacies into a harvested area. The amount, pattern and definition of retained structure vary; 10–30% is illustrative, not a universal sustainability threshold.
- Potential benefits: Retained trees and dead wood preserve some structural complexity and habitat refugia. Effects depend on the amount and placement retained, operations and landscape context; faster regeneration or a shorter rotation is not a defining property.
- Challenges: Retained trees susceptible to windthrow (blown over); need careful placement
- Use: Gaining popularity as compromise between productivity and conservation; research ongoing on optimal retention levels
- Outcome: Retention can preserve some legacies while timber is removed, but the harvested stand still changes. Monitor regeneration, windthrow, carbon, water and habitat-dependent species before claiming that biodiversity and all services were maintained.
4. Clearcutting: evaluate the prescription and setting
- Difference: Clearcut regeneration removes most or all overstory across a defined area, often with retained buffers or habitat structures. It may suit regeneration of some light-demanding species, but can carry substantial soil, stream, carbon and habitat costs.
- Recovery concern: A regenerated young forest is not equivalent to an old-growth ecosystem. Large trees, dead wood, complex structure and dependent species can require centuries to recover and may not return under short rotations. This concern is different from saying no clearcut prescription can ever meet any sustainability objective.
- Context: Some foresters argue clearcut + replant rotation is necessary for short rotation timber supply; others argue not truly sustainable because old-growth functions lost
- Conservation: Protect irreplaceable old-growth and sensitive habitats, retain riparian buffers and plan the size, location and timing of harvests. Compare a whole landscape and its objectives rather than judge biodiversity solely by timber regrowth.
Additional Sustainable Forestry Practices
Old-Growth Forest Protection
- Reserves: Protect appropriate old-growth and other high-conservation-value forests with effective long-term governance. Remaining proportions vary greatly among regions and definitions, so an undated 5–10% value should not be generalized globally.
- Biodiversity Value: Old-growth forests provide unique habitat for species requiring large trees, late-successional characteristics, old-growth microenvironments
- Carbon Storage: Old-growth stores massive carbon; climate mitigation value
- Challenge: Pressure to harvest remaining old-growth for profits; conservation lands must be legally protected long-term
Native Species Reforestation
- System: After harvest, replant with diverse native species rather than monocultures; matches original forest composition
- Benefits: Supports native biodiversity; ecosystem resilience; disease/pest resistance better than monocultures
- Challenges: More expensive than pine monoculture; slower growth to harvestable size; market challenges
- Reality: Industrial plantations usually monocultures; sustainable forestry should prioritize native diversity
Certification and Third-Party Verification
- FSC (Forest Stewardship Council): International certification verifying forests managed sustainably; consumers can identify certified wood products
- PEFC (Programme for Endorsement of Forest Certification): Alternative certification standard
- Market incentives: Certification may improve market access or support better practices. Price premiums and costs vary by product and region; a fixed 15–20% premium is not guaranteed.
- Limitations: Certification costs money; small/poor forests can't afford certification; greenwashing risk (certification standards vary)
- Incentive: Demand for certified products can encourage audited practices where standards, oversight and market access are effective. Trends in certified area require a dated report; certification complements rather than replaces field monitoring.
Sustainable Forestry vs. Clearcutting: Comparison
| Factor | Retention-oriented prescriptions | Clearcutting |
|---|---|---|
| Forest Structure | Partly retained; assess actual outcome | Most overstory removed in harvest area |
| Biodiversity | Often retains more existing structure | Community changes; responses vary |
| Soil Health | Depends on roads, soil and operations | Exposed to erosion |
| Water Quality | Depends on buffers and operations | Higher risk where exposed or compacted |
| Carbon Storage | Partly retained; assess actual outcome | Stocks and fluxes change over time |
| Timber Yield | Prescription- and site-dependent | Maximum (short-term) |
| Recovery Time | Ongoing (structure maintained) | Old-growth features can take centuries |
| Cost | Higher (selective labor) | Lower (machinery) |
| Sustainability | Requires effective long-term management | Evaluate objectives, context and safeguards |
Exam tip: Evaluate harvest in relation to net growth while also protecting biodiversity, soil, water, carbon and social values. Selection, shelterwood, variable retention and clearcut prescriptions have different regeneration goals. Certification is evidence of compliance with specified standards, not a guarantee of perfect outcomes or a substitute for monitoring.
Worked timber-volume balance
For a stated annual accounting interval, let G be growth, H harvest and M other volume loss, all measured on a consistent basis. If growth is 120 , harvest is 80 and other losses are 20 , over that year. Standing volume increases in this simplified budget. This alone does not demonstrate sustainability: habitat trees, species composition, soils, streams, carbon and community rights also require protection, and growth or disturbance can change.
Unit 5 Key Takeaways for AP Exam Success
Must-Know Concepts
- Tragedy of the Commons
- Clearcutting impacts
- Green Revolution pros/cons
- Agricultural impacts
- Irrigation efficiency methods
- Pest control approaches
- Overfishing/bycatch
- Mining environmental damage
- Urbanization impacts
- Ecological footprints
Common Mistakes to Avoid
- Green Revolution only positive (ignore negatives!)
- Confusing tree-cover recovery or timber regrowth with recovery of old-growth structures
- Assuming a high field application efficiency guarantees a fixed value or basin-wide water saving
- Chemical pesticides only solution
- Overfishing affects only fishers
- Mining damage can be fully remediated
- Using undated national footprint values or treating one indicator as proof of sustainability
- IPM not practical at scale
- Aquaculture has no environmental impacts
Study Strategies for Unit 5
Create comparison tables for land use impacts (clearcutting vs. sustainable forestry; feedlots vs. pasture; chemical pesticides vs. biological controls). Make timelines showing Green Revolution spread. Diagram fishery collapse and recovery. Calculate your own ecological footprint (online tools). Map urbanization impacts (habitat loss, stormwater runoff, urban heat islands). Understand sustainability as balancing environmental, economic, social factors. Know specific examples: Atlantic cod collapse, mountaintop removal, acid mine drainage, overfishing impacts.
Calculation checklist
- Use efficiencies as decimals when dividing crop demand by efficiency.
- State the original value in the denominator of a percentage reduction.
- Keep precipitation depth, area and volume units consistent.
- Distinguish yield per area, total production and nutritional output.
- Use matching footprint and biocapacity account years.
- Specify feed and weight-gain conventions for FCR and include losses in harvest budgets.
APES Unit 5 study notes FAQs
What do APES Unit 5 study notes cover?
These detailed Land and Water Use notes cover all 17 topics, including the commons, forestry, agriculture, irrigation, pest control, livestock, fishing, mining, urbanization, ecological footprints, sustainability, aquaculture and sustainable forestry. Diagrams and worked examples connect management choices with environmental effects.
Is drip irrigation always the most water-efficient method?
Well-managed drip systems can have high field application efficiency, but performance depends on scheduling, maintenance, soils and crop needs. Lower field withdrawals do not guarantee equal basin-wide savings because return flows, changes in crop area and consumption also matter.
How is an IPM action threshold different from an economic injury level?
The economic injury level is the pest density where expected economic loss equals the cost of control. An action threshold usually triggers intervention earlier to allow for pest growth and treatment delay. IPM also considers effectiveness, urgency, natural enemies and risk.
What does an ecological footprint measure?
It estimates demand for biologically productive land and water areas that provide certain resources and absorb carbon dioxide under the accounting method. Compare it with matching biocapacity and account years. It does not capture every pollutant, water-scarcity risk or biodiversity impact.
Is recirculating aquaculture pollution-free?
Recirculating systems treat and reuse water and can contain wastes and reduce water exchange. They still require energy, make-up water and management of sludge and dissolved nutrients. A biofilter transforms ammonia through microbial processes rather than making all nitrogen disappear.
How much of the APES multiple-choice section is Unit 5?
College Board assigns Land and Water Use a 10–15% weighting in the multiple-choice section. Use this range to guide revision, and practise explaining mechanisms, assessing trade-offs, reading diagrams and calculating with consistent units.