
Variables and Data Types
What does each row of data describe? What do the numbers and labels mean? Learn to identify variables, classify their types, and tell a sample statistic from a population parameter.
By the end of this lesson, you should be able to:
- Identify an observational unit, a variable and a recorded value in a study.
- Explain whether a variable is categorical or quantitative.
- Distinguish discrete and continuous quantitative variables.
- Identify parameters and statistics, and explain them in context.
Before you start: Know the difference between a population and a sample. Need a reminder? Review Topic 1.1.
First time learning this? Start with the school data table, then follow the classification steps.
Here to revise? Review the key ideas, then try the practice questions.
The concept in 60 seconds
An observational unit is who or what we collect information about. A variable is a characteristic we record about that unit. A value is the answer or measurement recorded for one unit.
Student → travel time → minutes.
The student is the unit. Travel time is the variable. The recorded minutes is one value.
Some variables describe categories, such as bus, car or walk. Others describe quantities, such as minutes or a number of siblings. For quantities, ask whether the possible values are separate, countable values or measurements that can vary throughout an interval.
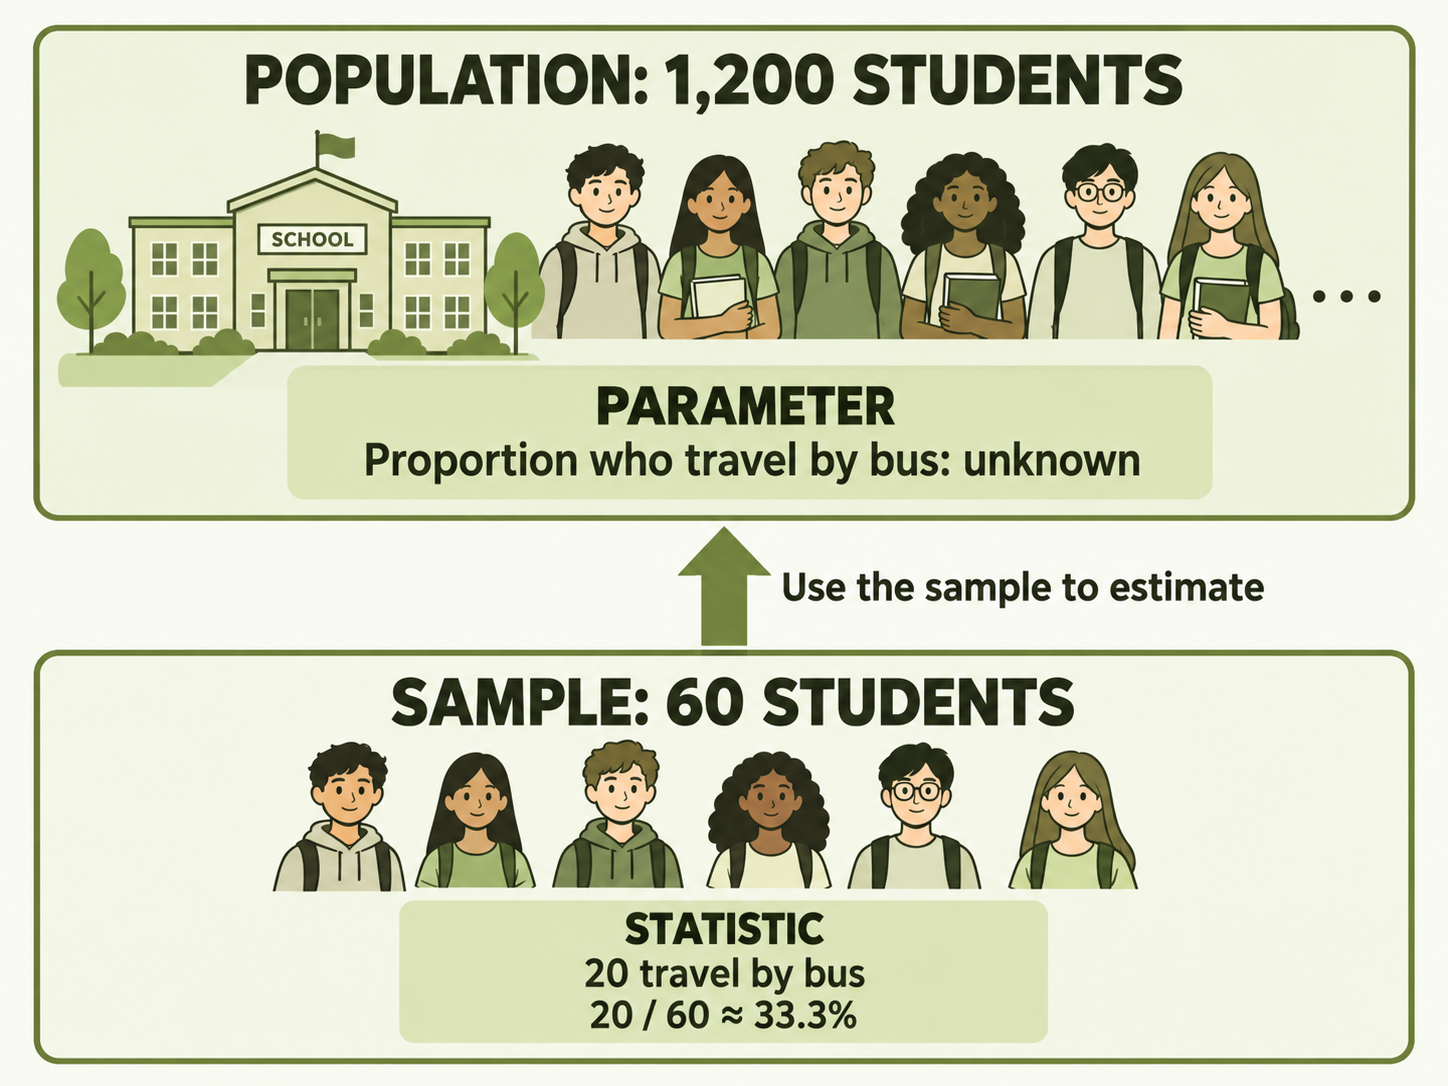
When we summarize a whole population, we describe a parameter. When we summarize a sample, we calculate a statistic. The group being summarized decides which word to use.
What can we record about Cedar High students?
In Topic 1.1, Cedar High had enrolled students and selected a sample of . We will reuse that fictional teaching scenario. For this lesson, the school records each selected student’s code, main travel method, one-way travel time on the Tuesday being studied, and number of siblings.
Here are example records from the sample of :
| Student code | Main travel method | Travel time (minutes) | Number of siblings |
|---|---|---|---|
| 101 | Bus | ||
| 102 | Walk | ||
| 103 | Car | ||
| 104 | Bus |
The other sample records are not shown. These rows do not reduce the sample size to . The codes identify students; they are not student counts.
Predict before reading on: Which columns contain labels? Which contain amounts? Does the student code become quantitative just because it uses digits?
Check your prediction
Travel method is a category. Student code is an identifying label, even though it uses numbers. Travel time is a measured amount; number of siblings is a counted amount. The students are the observational units.
Observational units, variables and values
Observational unit
The person, object or other item described by an observation.
Here: an individual selected Cedar High student.
Variable
A characteristic that can differ from one unit to another.
Here: main travel method, travel time or number of siblings.
Value
The particular category or amount recorded for a variable.
Here: “Bus” is one travel-method value; minutes is one travel-time value.
Data set
The collected records we use to investigate a question.
Here: the information recorded for all selected students.
A useful way to read a data table
In a table with one record per individual, a row describes an observational unit and a column records a variable. Read the study description too: if the same person has several records, the question may focus on people, visits or another kind of unit.
Do not name the unit by guessing the largest group mentioned. If a table records information about schools, the units may be schools even when the measurements concern students at those schools.
Can data include more than numbers?
Yes. Text responses, photographs, audio and video can provide information. A written answer might describe a travel method; a photograph might help identify a bird species. Ask what characteristic is recorded and what each observation describes, rather than assuming all data must begin as numbers.
How to classify a variable
Categorical
Values name categories or act as labels. Another name is qualitative.
Examples: travel method, blood type, yes/no response, or a bus route code.
Quantitative
Values describe numerical amounts. Another name is numerical.
Examples: travel duration in minutes, height in centimeters, or number of siblings.
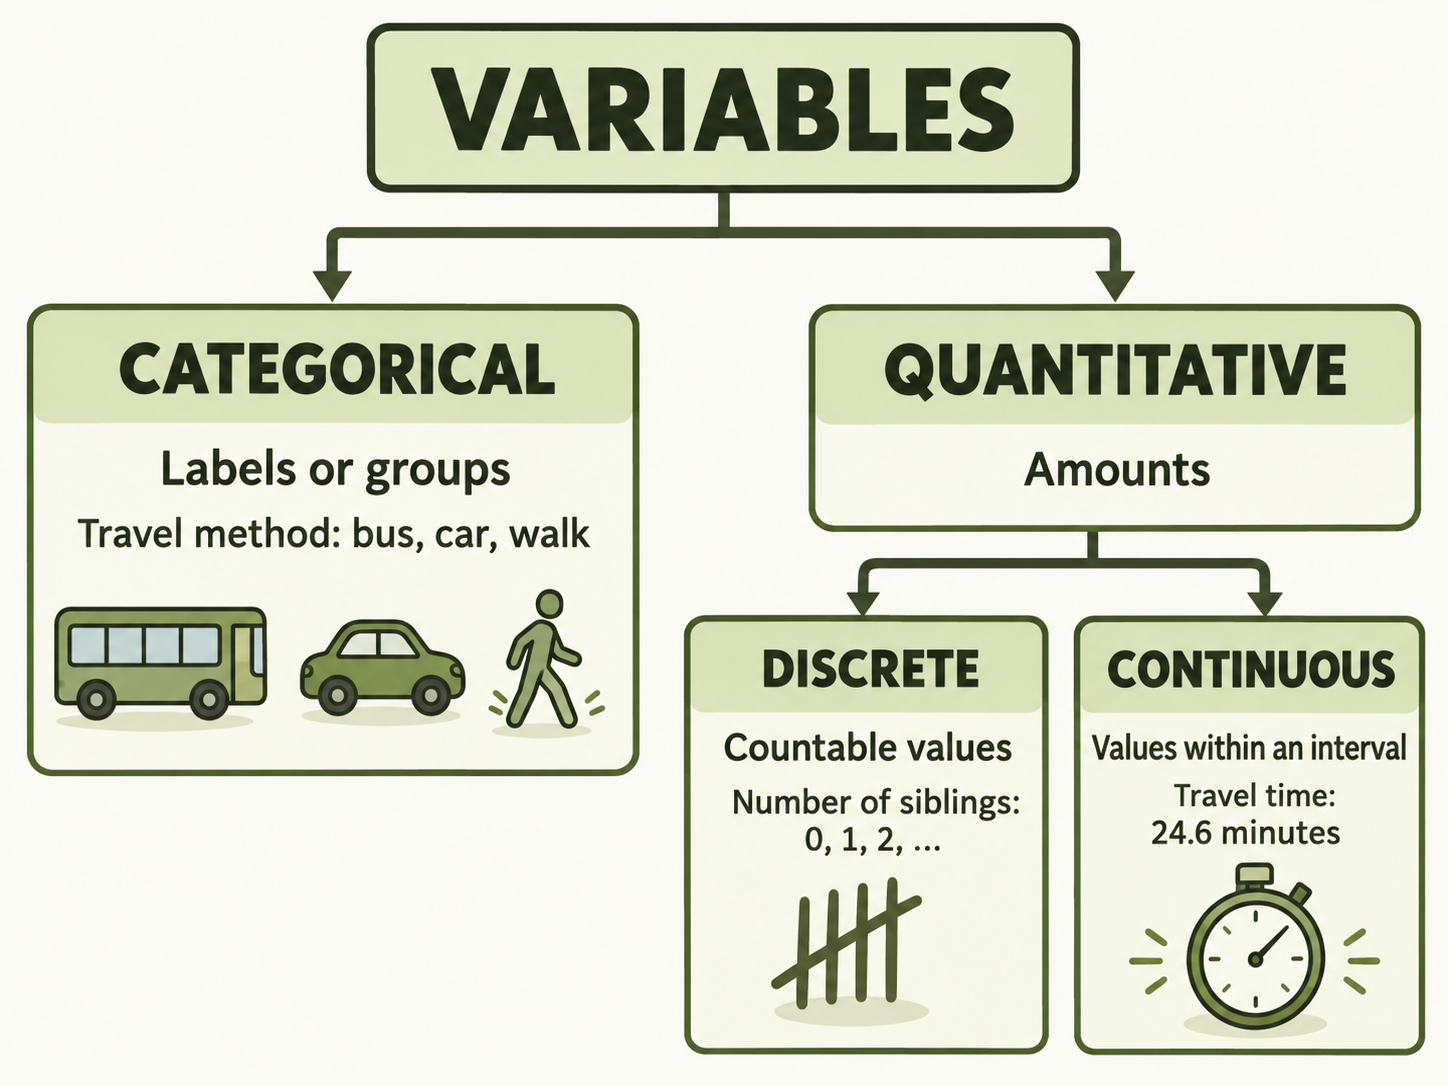
Discrete versus continuous: look at the possible values
Discrete quantitative
The possible values can be counted or listed. There may be finitely many values or a never-ending countable list.
Number of siblings can be , and so on. A value such as siblings is not possible.
Continuous quantitative
A measurement can take any value within an interval in the model.
Travel duration could be minutes, minutes, minutes or a value between those measurements.
Precision is not the same as variable type. Recording travel time to the nearest minute rounds a continuous duration. Seeing only whole numbers in the table does not, by itself, make the underlying duration a discrete count.
Discrete values do not have to be whole numbers. If a quiz awards scores only in half-point steps, the possible scores form a discrete list: , and so on up to the maximum. The key is the set of allowed values, not the presence of a decimal point.
Numbers can also be category labels
A student code of 101 does not mean “ students.” It identifies a student. Similarly, route 12 and route 18 identify different bus routes; route 18 is not a measured amount six units greater than route 12.
Ordered categories still remain categories when they describe levels rather than measured amounts. For example, “low,” “medium” and “high” satisfaction are ordered labels. Check the meaning and definition of the variable before classifying it.
Parameter versus statistic
A parameter describes the population. A statistic describes a sample. Both can be numerical summaries, such as a mean or a proportion. A proportion is the fraction of a group with a particular characteristic.
Parameter: whole population
The proportion of all Cedar High students whose main travel method on the Tuesday being studied is bus.
This population proportion is unknown unless we have suitable information about the whole population.
Statistic: selected sample
Suppose of the selected students travel by bus. The sample proportion is , or approximately .
This result summarizes the sample of , not all students.
The result for out of students is an invented summary of the full teaching sample. It is not calculated from the preview rows.
Useful notation: connect each symbol to its group
| Summary | Population parameter | Sample statistic |
|---|---|---|
| Mean: the average of quantitative values | (mu): population mean travel time | (x-bar): sample mean travel time |
| Proportion: the fraction in a category | : population proportion travelling by bus | (p-hat): sample proportion travelling by bus |
and still describe the population and sample sizes from Topic 1.1. They count students. The mean travel time is measured in minutes; a proportion is a fraction without measurement units.
Size does not decide the label. A summary from a large sample is still a statistic. A summary describing an entire small population is a parameter. Also, a parameter can be known; “unknown” is common, but is not its definition.
Worked examples
Example 1: Read a student’s record
Question: Identify the unit, variables and variable types in the Cedar High data table. Then explain what the value represents.
- Find the unit. One record describes one selected student, so a student is an observational unit.
- Separate the columns. Student code is an identifying label. Main travel method names a category. Travel time records an amount in minutes. Number of siblings records a count.
- Classify by meaning. Student code and travel method are categorical. Travel duration is quantitative continuous. Number of siblings is quantitative discrete.
- Interpret the value. Student 101’s one-way home-to-school journey took minutes on the Tuesday being studied.
Reflect: “Bus” and “” are recorded values. They are not the names of the variables.
Example 2: Identify a statistic and its target parameter
Question: Suppose the mean travel time for the full sample of selected students is minutes. Identify the statistic and the parameter the school wants to estimate.
- Ask which group produced . It comes from the selected students, so it is a sample statistic: .
- Name the target group. The school wants to learn about all enrolled students.
- Name the matching population summary. The parameter is the mean one-way travel time, in minutes, for all enrolled students on the Tuesday being studied.
- Avoid turning an estimate into a fact. We do not know that equals minutes just because does.
The -minute mean is an invented full-sample summary, not the mean of the displayed rows.
Example 3: The definition changes the classification
Question: A researcher records exact age in years, number of completed years of age, and an age group such as “under 16” or “16–18.” Classify each variable.
- Exact elapsed age: quantitative continuous. Age is elapsed time and can take fractional values between years.
- Number of completed years: quantitative discrete. As defined, its values are , and so on.
- Age group: categorical. Each value is a group label, even when the label includes numbers.
Reflect: Do not classify a vague word such as “age” in isolation. Use the way the study defines and records it.
How to explain an answer in context
A useful answer names the actual unit or variable and explains the classification. Give the reader more than a one-word label.
| Weak answer | Improved answer | Why it is clearer |
|---|---|---|
| “The variable is students.” | “A selected Cedar High student is the unit. One variable is that student’s one-way travel time in minutes.” | Separates who is studied from what is recorded. |
| “It is continuous because it has decimals.” | “Travel duration is quantitative continuous because it is a measurement that can vary throughout an interval of times.” | Uses possible values rather than the appearance of the data. |
| “ is a parameter.” | “Approximately is a statistic because it summarizes the bus-travel category among the sampled students.” | Identifies the group summarized and the characteristic. |
Writing frame for a variable: “[Variable] is [type] because its values represent [labels / countable amounts / measurements within an interval].”
Writing frame for a summary: “[Summary] is a [parameter / statistic] because it describes [the whole population / the selected sample] of [units in context].”
Common mistakes and how to correct them
Confusing a unit with a variable
Mistake: “The variable is a student.”
Fix: The student is the unit. Travel method or travel time is a variable recorded about that student.
Classifying by digits alone
Mistake: “Student code is quantitative because it is 101.”
Fix: The code is an identifier. A number can be a label rather than an amount.
Using decimals as the test
Mistake: “Whole-number data must be discrete.”
Fix: A continuous measurement may be rounded. Some discrete variables also allow decimal values.
Calling a sample result a parameter
Mistake: “The sample mean is the population parameter.”
Fix: A statistic can estimate a parameter, but the two describe different groups.
Assuming unknown means parameter
Mistake: “If the value is known, it cannot be a parameter.”
Fix: Population versus sample decides the label. A population parameter can be known if the necessary population information is available.
Try a correction: “The observational units are travel times. Travel method is quantitative because we coded . The sample result is the school’s exact bus-travel proportion.”
Show the corrected reasoning
The observational units are students. Travel times are values of a variable. Travel method remains categorical: 1, 2 and 3 stand for group labels. The approximately sample proportion is a statistic that may help estimate the school’s population proportion; it is not automatically the exact population value.
Check your understanding: practice with solutions
These are original AP-style practice questions. Try a question, use the hint if needed, then explain why the solution makes sense.
1. Identify a unit, variable and value
A researcher surveys students about the number of books they read last month. One student reports . Identify an observational unit, the variable and this recorded value. Classify the variable.
Hint
Separate the person from the characteristic and that person’s answer.
Solution and reasoning
An observational unit is a surveyed student. The variable is the number of books read last month. The recorded value is books. The variable is quantitative discrete because it is a count with separate whole-number possibilities.
2. Recognize a numerical label
A transport company records route codes 12, 18 and 25 for buses. The codes identify routes. How should the route-code variable be classified?
- Quantitative continuous, because routes have lengths.
- Quantitative discrete, because the codes are whole numbers.
- Categorical, because the codes name routes.
- A statistic, because several buses are recorded.
Hint
The question concerns the route code, not route length or the number of buses.
Solution and reasoning
C. Route codes are category labels. Route length would be a different variable. A statistic is a numerical summary of sample information, rather than a variable type.
3. Classify by the possible values
Classify each variable as categorical, quantitative discrete or quantitative continuous: (a) exact running duration in seconds, recorded to the nearest second; (b) number of attempts to finish a puzzle; (c) quiz score when only half-point steps are awarded; (d) satisfaction recorded as low, medium or high.
Hint
Rounding does not change an underlying duration into a count. A list of permitted half-point scores is still countable.
Solution and reasoning
(a) Quantitative continuous: the underlying elapsed duration can take values throughout an interval, although recorded values are rounded. (b) Quantitative discrete: attempts are counted. (c) Quantitative discrete: only specified score steps are permitted. (d) Categorical: the values are ordered category labels.
4. Identify the statistic and parameter
A school has enrolled students. In a sample of students, report walking to school on Monday. Identify the sample statistic, then describe the corresponding population parameter.
Hint
One proportion concerns the selected students. The other concerns all students.
Solution and reasoning
The sample proportion , or , is a statistic. The parameter is the proportion of all enrolled students who walked to school on that Monday. Its value is not given. Do not assume the population proportion must be .
5. Find the observational unit
A district data table has one record per school. It lists school code, number of students enrolled and mean student commute time in minutes for each school. Are the observational units schools or students? Classify school code and enrollment count.
Hint
Ask what each record describes, rather than choosing the people mentioned in a measurement.
Solution and reasoning
The observational units in this table are schools. Each row describes one school, even though two characteristics concern its students. School code is a categorical identifier. Enrollment count is quantitative discrete because it counts students at a school.
6. Correct a parameter–statistic mistake
A researcher calculates the mean height of every member of a small club. A student says, “That mean must be a statistic because the club is small and the mean is known.” The target population is the club’s entire membership. Correct the reasoning.
Hint
Use the target group and the group actually summarized. Neither size nor knowledge of the result decides the label.
Solution and reasoning
The mean is a parameter for the stated population because it summarizes the entire club membership. A parameter can describe a small population and can be known. If the club members were instead a sample used to study a wider population, the same mean would play the role of a statistic for that wider investigation.
Quick revision notes
- Unit: who or what an observation describes.
- Variable: a characteristic recorded about a unit.
- Value: one recorded answer or measurement.
- Categorical: labels or groups; numerical codes can still be categorical.
- Quantitative: measured or counted amounts.
- Discrete: a finite or countably infinite set of possible quantitative values.
- Continuous: a quantitative measurement modeled as taking any value in an interval.
- Parameter: a numerical attribute or summary describing the population.
- Statistic: a numerical attribute or summary describing a sample.
- Explain in context: name the actual unit, variable or summarized group.
Memory check: Who is described? What is recorded? Is it a label or an amount? What values are possible? Does the summary describe the sample or the population?
A final AP-style understanding check
A school district operates buses. It randomly selects buses and makes one record for each selected bus. The recorded characteristics are bus ID number, fuel type (diesel or electric), number of passenger seats, and bus length in meters. The sample’s mean bus length is meters.
- Identify the observational units, population and sample.
- Classify all four recorded characteristics. Explain why bus ID and number of seats have different types, even though both use numbers.
- Identify what meters represents and describe the corresponding population parameter.
Show a model answer and self-check
(a) An observational unit is a bus. The population is all district buses; the sample is the selected buses. and .
(b) Bus ID is a categorical identifier. Fuel type is categorical. Number of seats is quantitative discrete because it is a count. Bus length is quantitative continuous because it is a measurement that can vary throughout an interval. An ID labels a bus; a seat count measures how many passenger seats it has.
(c) The -meter sample mean, , is a statistic because it summarizes the sampled buses. The corresponding parameter is the mean length, in meters, of all district buses. That population mean is not given.
Self-check: Did you name buses as the units, separate the population from the sample, explain the four classifications, and identify the mean’s group and units?
Before you move on, check that you can:
- Separate a unit, a variable and a value in a new study.
- Explain why an ID number is a label.
- Use possible values to distinguish discrete and continuous variables.
- Describe a statistic and its matching parameter without assuming they are equal.
Continue learning
Now that you can identify categorical variables, learn how to organize their values into frequency and relative frequency tables.
Next lesson
Topic 1.3: Tabular Representation and Summary Statistics for One Categorical Variable →Use counts and proportions to describe how observations are distributed across categories.
Previous: Topic 1.1 · Review variable types · Back to the lesson overview