
Introduction to Statistics and Investigative Questions
Start with a question, collect useful data, and learn about a group. Use a school travel-time example to understand population, sample and investigative questions.
By the end of this lesson, you should be able to:
- Identify the population, sample, population size and sample size in a study.
- Recognize a question that needs data, and rewrite a vague question clearly.
- Explain who is being studied and what information needs to be collected.
Before you start: No earlier statistics lesson is needed. Think of a whole group and a smaller group chosen from it.
First time learning this? Read the school example, then work through the two solved examples.
Here to revise? Review the key ideas, then try the practice questions.
The concept in 60 seconds
Statistics helps us learn from data. Data are the information we collect, such as students’ travel times or their lunch choices.
Start with two questions: What do we want to find out? and Who do we want to learn about? Then decide what information to collect. Often we measure a smaller group because measuring everyone would take too much time.
Remember these two groups: The population is the group we want to understand. The sample is the part of that group from which we collect data.
For example, a school may want to understand students’ travel times. It can collect travel times from some students and look at the differences. Whether those results tell us about the whole school depends on how the students were chosen and how the study was carried out.
A school wants to understand morning travel times
Fictional teaching scenario: Cedar High has students enrolled in grades 9–12. The school wants to understand how long students take to travel from home to school on one Tuesday during the school term. It randomly selects of those students and records each selected student’s one-way travel time, in minutes.
Predict before you read on: Is the group the school wants to understand the same as the group it measures? Which number describes each group?
A suitable investigative question is:
“How do one-way morning travel times vary among students enrolled at Cedar High on the Tuesday being studied?”
The school is interested in all students, but measures only the selected . Each travel time is a piece of data. Here is a preview of observations from the teaching sample:
These values are a preview, not the complete sample of . They are invented to illustrate the lesson and are not school research findings.
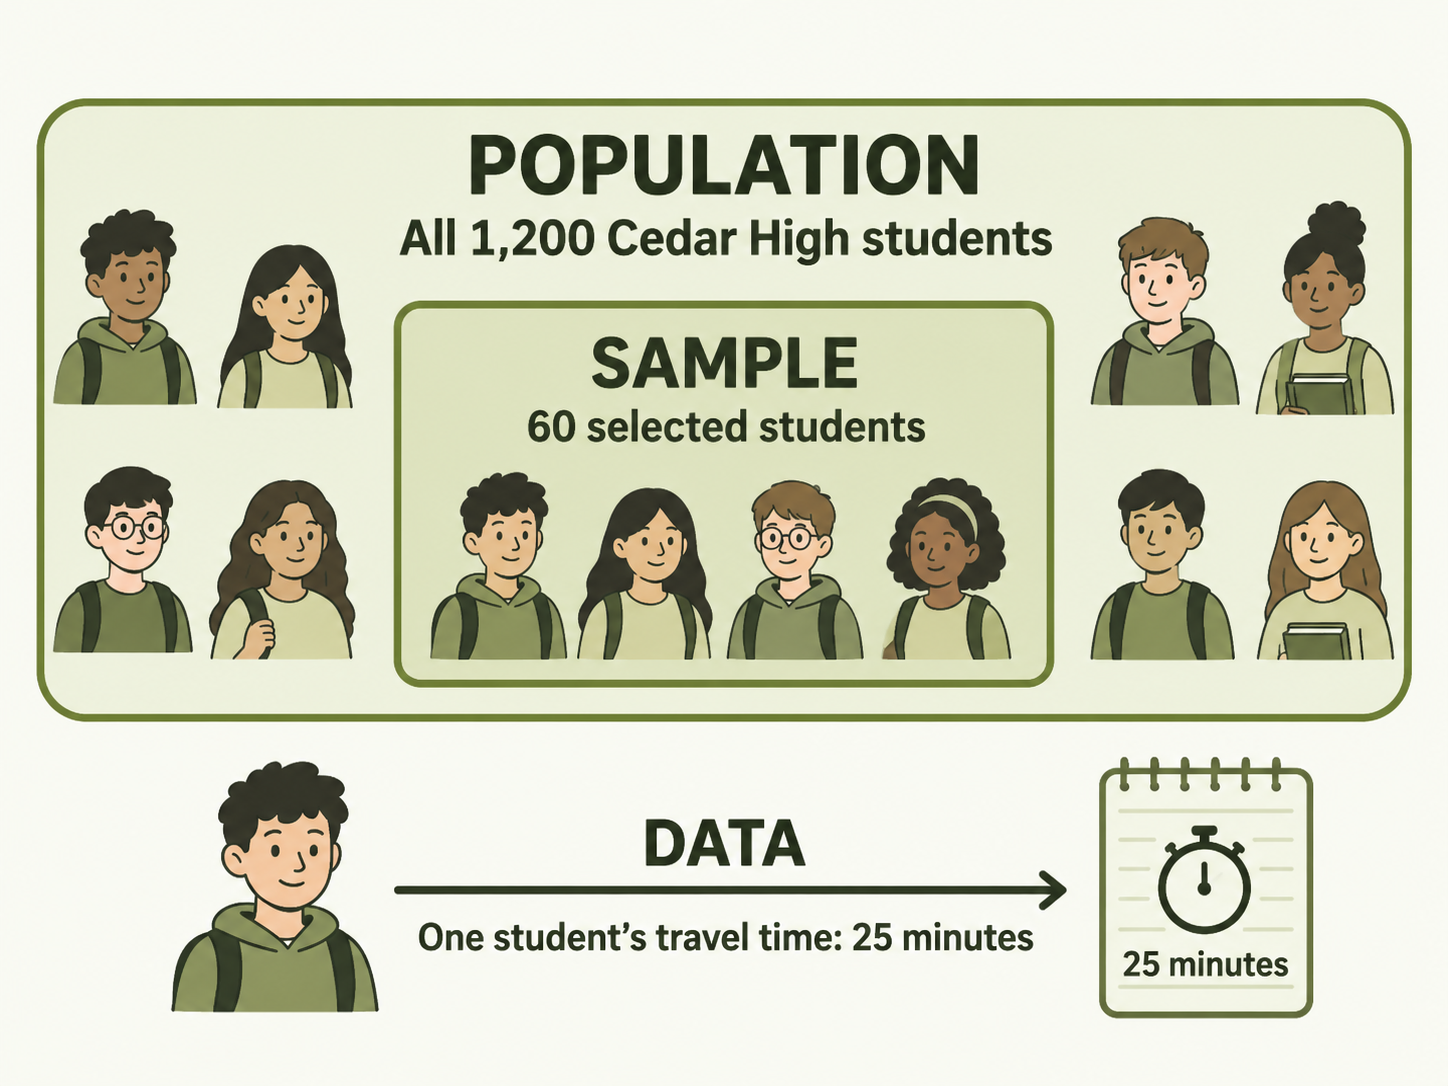
Key ideas: population, sample, data and context
Population
The whole group we want to learn about.
Here: all students enrolled at Cedar High.
Sample
The smaller group we collect information from.
Here: the selected Cedar High students.
Datum / data
The information we record. One piece is a datum; the collected pieces are data.
Here: minutes is one student’s recorded travel time. All recorded times form the data set.
Investigative question
The main question a study tries to answer.
Here: how students’ travel times vary on the Tuesday being studied. “Vary” means differ.
Context
The details that make the data meaningful. Name who or what is studied, what is recorded, and the setting.
Here: Cedar High students, home-to-school travel time in minutes, and the Tuesday being studied.
The notation you need
represents the population size; represents the sample size. In our scenario, and . These count students, not minutes. Keep the uppercase and lowercase letters distinct.
Why study a sample?
Measuring everyone can be expensive, slow or impossible. Imagine testing how long every light bulb lasts: the tested bulbs would be used up and could not be sold. Studying a carefully chosen sample uses fewer resources.
A sample does not automatically represent its population well. Asking only students waiting at the bus stop could miss walkers or students arriving by car. Sampling methods and bias are developed in later lessons.
A brief bridge to Topic 1.2
In our example, we study students and record their travel times. In Topic 1.2, you will learn the terms used to describe individuals, variables, parameters and statistics. For now, focus on who is studied and what is recorded.
How to build a useful investigative question
A statistical question needs data and allows for differences in the answers. Those differences are called variation. For example, students will not all have the same travel time.
A question may describe one group, compare groups or explore a relationship. Make it clear enough that someone else can tell what information to collect.
“Are journeys bad?” leaves both the group and meaning of “bad” unclear. “How do one-way morning travel times vary among Cedar High students on the Tuesday being studied?” gives a group, a measurable characteristic and a time setting.
| Question | What to notice |
|---|---|
| What is ? | A fixed calculation answers it; collecting variable observations is unnecessary. |
| How many students are enrolled at Cedar High today? | As stated, this asks for one administrative count, not variation across observations. |
| How do travel times vary among Cedar High students on Tuesday? | Suitable for investigation: students can have different travel times. |
| How does one student’s travel time vary over school days? | Also statistical: observations vary across days, even though one student is studied. |
| Why are bus journeys always worse? | Assumes a conclusion and leaves “worse” undefined. Specify a measurable comparison instead. |
Investigative question versus survey question
The investigative question is the study’s big question about a group. A survey question asks one person for information. Many individual answers can help answer the big question.
For Cedar High, “How do travel times vary among students?” is the investigative question. “How many minutes did your one-way journey from home to school take this Tuesday?” is a survey question. Each student’s answer contributes to the wider investigation.
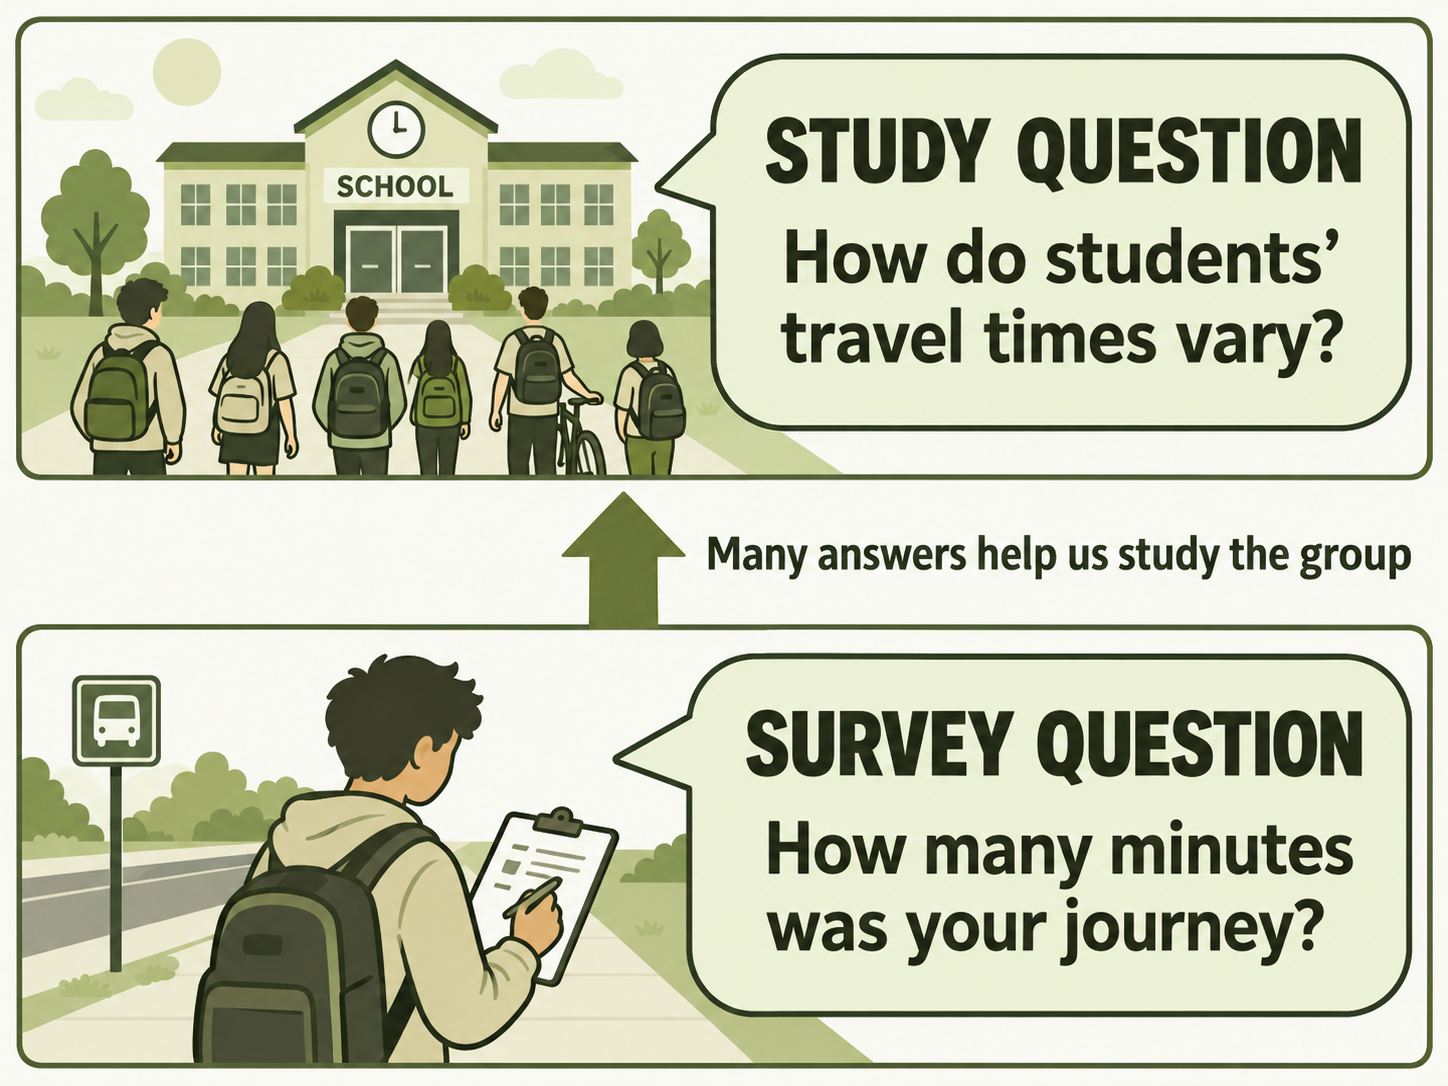
Keep the original purpose visible. Decide the study question before examining results. If you notice something interesting in the results, you can ask a new question. Make clear that it is a new question rather than the one you started with.
Worked examples
Example 1: Identify a study’s components
Question: Use the Cedar High scenario to identify the population, sample, , and data needed.
- Identify the target. The school wants to understand students enrolled at Cedar High. Therefore, the population is all enrolled students.
- Find the measured group. Information is gathered from selected students. Those students are the sample.
- Match the counts. Population size ; sample size .
- Describe the recorded information. Record each selected student’s one-way home-to-school travel time in minutes on the Tuesday being studied.
- Check the context. Both groups are described as students at this school. The data are travel times, not the students themselves.
Reflect: If the school instead wanted to understand only grade 12 students, the target population would change. The population is defined by the investigation’s purpose.
Example 2: Improve a vague question
Starting question: “Do students waste too much time travelling?”
- Find the unclear words. “Students” does not identify a school, “too much” has no defined threshold, and “waste” assumes a negative judgment.
- Choose a measurable purpose. Investigate how many enrolled Cedar High students have a journey longer than minutes on the Tuesday being studied.
- Write the improved question. “What proportion of students enrolled at Cedar High have a one-way morning journey longer than minutes on the Tuesday being studied?”
- Identify the required data. Record the travel time of each selected student and whether it exceeds minutes. Exactly minutes does not meet “longer than .” If is a student’s travel time in minutes, the condition is .
- Check that you can collect the data. Ask each selected student to measure the journey in the same way: from leaving home to arriving at school.
Reflect: This is an alternative investigation planned before collecting data. It is not a reason to replace the original question after seeing results.
How to explain an answer in context
Use the details from the problem in your answer. Saying “the population is the whole group” gives a definition, but does not tell the reader which group you mean.
| Weak answer | Improved answer | Why it is clearer |
|---|---|---|
| “The population is everyone.” | “The population is all students enrolled at Cedar High.” | Names the exact group the question concerns. |
| “The sample is .” | “The sample is the selected Cedar High students; its size is .” | Distinguishes the group from its numerical size. |
| “They need numbers.” | “They need each selected student’s one-way travel time in minutes on the Tuesday being studied.” | Identifies what is measured, its units and setting. |
Useful writing frame: “The population is [complete group of interest]. The sample is [selected group measured]. To address the question, collect [specific information] from [individuals or items] during [relevant setting or period].”
Adapt the frame to the actual prompt. Include the details requested and support them with the study description.
Common mistakes and how to correct them
| Mistake | Why it fails | Fix |
|---|---|---|
| Calling the population. | It is the group’s size, not the group itself. | Name all enrolled Cedar High students; then state . |
| Calling the recorded travel times the sample. | These are the data collected from the sample. | The sample is the selected students; their times are the data. |
| Treating every question with a number as statistical. | A fixed calculation can use numbers without studying variation. | Ask whether data across observations are needed. |
| Using “students” without defining which students. | The target group is unclear. | Name the school, grade or other boundary relevant to the question. |
| Assuming a larger sample guarantees a fair study. | More observations do not automatically fix how the sample was selected. | Consider which members of the population could be included. |
| Changing the original question after seeing results. | The reported purpose no longer matches what was planned. | Preserve the original question and describe a new one separately. |
Try a correction: A student writes, “The population is the students, and the sample is the travel times shown.” Identify both errors before opening the explanation.
Show the corrected reasoning
The population is all enrolled students, because that is the group the question concerns. The sample is the selected students. The displayed travel times are a partial preview of the data; they do not change the sample size to .
Check your understanding: practice with solutions
These are original AP-style practice questions. Try each question first, use a hint if needed, then compare your reasoning with the solution.
1. Identify the population and sample
A public library wants to investigate first-visit lengths among the registered members who visited during March. It selects of those members and records how long each selected member’s first March visit lasted. Identify the population, sample, and .
Hint
Separate the group the question concerns from the group actually selected.
Solution and reasoning
Population: all registered library members who visited during March. Sample: the selected members from that group. ; . Visit durations are the data recorded for those members, not the members themselves.
2. Recognize a statistical question
Which question most clearly requires a statistical investigation?
- What is the library’s street address?
- How do first-visit durations vary among registered library members during March?
- What is ?
- Who is the library director?
Hint
Look for observations that may differ and information that must be collected.
Solution and reasoning
B. Different members can spend different amounts of time on their first March visits, so data are needed to examine the variation. A and D ask for single factual information; C asks for a fixed calculation.
3. Improve the investigative question
A researcher writes, “Why is the new school lunch better?” Rewrite this as a neutral, answerable investigative question about students at Brook School.
Hint
Choose a measurable meaning for preference and specify the students and timing.
One possible solution
“What proportion of students enrolled at Brook School who have tried both menus prefer the new lunch menu to the previous menu during the first month of the change?”
This names a group whose members can make the comparison, defines the information to collect and avoids assuming the new menu is better. Other clear, feasible rewrites can also be valid.
4. Identify the information needed
A school asks, “Is students’ nightly sleep duration associated with their next-morning alertness rating during a specified school week?” What information should it collect?
Hint
Match each student’s sleep hours with that same student’s rating the next morning.
Solution and reasoning
For each selected student, record sleep duration in hours for each specified night and the next morning’s alertness rating using the same defined scale. Keep the student and night/morning pairing identifiable with a study code.
Collecting sleep durations from one group and unrelated ratings from another would not provide the required paired information. An association alone would not establish that more sleep caused greater alertness.
5. Find the group-size confusion
A factory produces batteries in a batch and tests . A student says, “The population is , the sample is and the data are the tested batteries.” Rewrite the answer accurately.
Hint
Groups contain items. Their sizes are counts. Data describe recorded characteristics of the items.
Solution and reasoning
The population is all batteries in the batch, with . The sample is the tested batteries, with . The data are the measured test outcomes, such as each tested battery’s operating lifetime in hours, if that is what the investigation measures.
6. Keep the study purpose clear
A coach plans to investigate players’ practice attendance. After inspecting the records, the coach notices an interesting pattern in goals scored and reports that the original study was designed to investigate scoring. Explain the problem and a better approach.
Hint
Separate the question planned before analysis from a new question suggested by results.
Solution and reasoning
The reported original purpose was changed to fit a finding seen during analysis. The coach should keep the attendance question as the original purpose and identify the scoring question as a new investigation. The coach can then determine whether suitable additional data or a new study are needed.
Quick revision notes
- Population: the entire group the investigation concerns.
- Sample: the selected part from which data are gathered.
- : population size. : sample size.
- Data: recorded information; a single recorded piece is a datum.
- Investigative question: establish a clear purpose before analyzing results.
- Useful question: define the group and information so suitable data can be gathered and analyzed.
- Statistical reasoning: anticipate differences across people, items or repeated observations.
- In context: name the actual group, characteristic, units and relevant setting.
Memory check: Who do we want to understand? Who did we measure? What did we record? What question will those data address?
A final AP-style understanding check
A city wants to understand weekday waiting times at its bus stops during October. It randomly selects bus stops. At each selected stop, observers record the waiting time in minutes of the first passenger arriving after 8:00 a.m. on each of specified weekdays.
- Write a clear investigative question consistent with this study.
- Identify the population and sample of bus stops, and state and .
- Describe the data collected and explain why recorded waiting times do not make the sample size of bus stops equal to .
Show a model answer and suggested scoring checklist
(a) “How do waiting times vary for the first passengers arriving after 8:00 a.m. at the city’s bus stops on the specified October weekdays?” The scope matches the passengers and period actually observed.
(b) The population of stops is all city bus stops. The sample of stops is the selected stops. and .
(c) Record the specified passenger’s waiting time in minutes at each selected stop on each of the days. There are waiting-time observations, but only distinct sampled stops. Here refers to the sample of stops.
Suggested checklist: a clear answerable question; the correct target group; the correct selected group; correct and ; and a distinction between sampled stops and repeated observations. This is NUM8ERS practice guidance, not an official College Board scoring rubric.
Before you move on, check that you can:
- Name a population and sample without substituting only their sizes.
- Explain what counts as data in a new situation.
- Improve a question by specifying its group, information and scope.
- Distinguish a study’s investigative question from a survey question.
- Keep conclusions and descriptions tied to the study’s context.
Continue learning
This is the first topic in the revised course sequence. Next, formalize the language used to describe individuals and the characteristics recorded about them.
Next lesson
Topic 1.2: Variables and Data Types →Build on this lesson with observational units, types of variables, parameters and statistics.
Review population versus sample · Review question construction · Back to the lesson overview