
Early 2026 AP Biology worked solutions
Early Solutions to the 2026 AP Biology FRQs | Step by Step
Work through all six free-response questions with the experiment logic, data evidence, biological mechanisms, calculations, graph interpretation, and final wording made explicit.
Important: These are early, unofficial solutions based on the uploaded independent educational solution guide. They are not official College Board scoring guidelines. Numerical graph readings are approximate where the source PDF reports them as approximate.
What each 2026 AP Biology FRQ tests
For broader review, use the verified AP Biology guide or browse the AP Biology FRQ archive.
Free-response question 1
Nucleotides, stomatal closure, and DORN1 signaling
Experimental design and cell signaling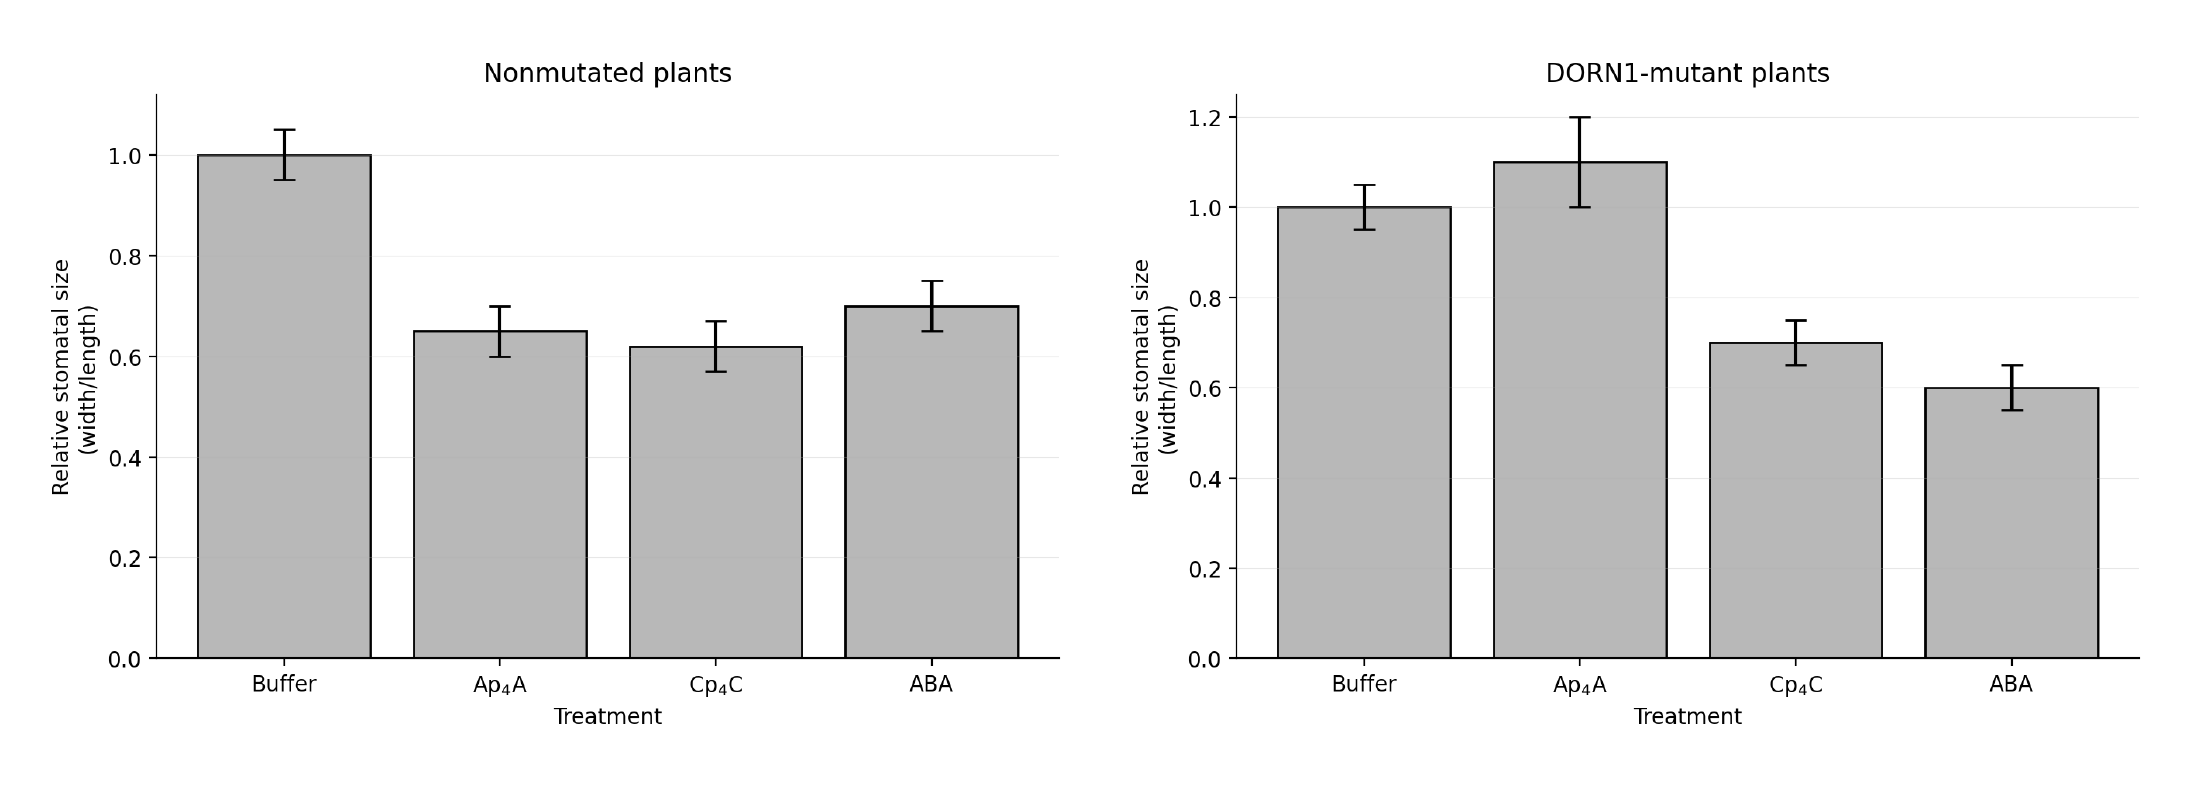
Part A: Identify the structural components of a nucleotide
-
Recall what a nucleotide is.
A nucleotide is the monomer of nucleic acids and can also function in signaling and energy transfer.
-
Name the three components.
Each nucleotide contains a phosphate group, a five-carbon sugar such as ribose or deoxyribose, and a nitrogenous base.
Part B(i): Identify the dependent variable
-
Separate the changed variable from the measured variable.
The scientists changed the compound added to the buffer, making treatment the independent variable.
-
Identify the measurement.
They measured the stomatal width-to-length ratio and expressed it relative to the buffer-only sample.
Part B(ii): Compare Cp4C with the buffer treatment
-
Read the approximate bar heights.
The buffer baseline is approximately \(1.00\), while the Cp4C treatment is approximately \(0.62\).
-
Calculate the difference from baseline.
\[ 1.00-0.62=0.38 \]The Cp4C value is therefore about \(38\%\) below the buffer baseline.
-
Translate the lower ratio biologically.
A smaller width-to-length ratio indicates smaller, more closed stomata.
Part B(iii): Explain why buffer alone is a control
-
Recognize the possible confounding factor.
The experimental compounds are dissolved in buffer, so the buffer itself could affect the leaf tissue.
-
Identify the shared conditions.
The buffer-only plants experience the same light exposure, handling, solvent, and timing as the treated plants.
-
State the controlled conclusion.
Differences from the buffer group can be attributed more confidently to Ap4A, Cp4C, or ABA instead of to the procedure.
Part C(i): Explain why ABA is included
-
Use known ABA biology.
Abscisic acid, or ABA, is known to cause stomatal closure.
-
Classify the control.
Because ABA is expected to produce closure, it serves as a positive control.
-
Explain what its response verifies.
ABA still reduces stomatal size in DORN1 mutants, showing that their guard cells and downstream closing machinery can respond. The missing Ap4A response is therefore linked specifically to DORN1 signaling rather than a general inability to close.
Part C(ii): Compare Ap4A and Cp4C in DORN1 mutants
-
Read the mutant Ap4A bar.
The relative stomatal size after Ap4A treatment is approximately (1.10).
-
Read the mutant Cp4C bar.
The relative stomatal size after Cp4C treatment is approximately (0.70).
-
Compare the biological effects.
Cp4C produces much more closure than Ap4A in the mutant plants. The displayed error bars are separated, strengthening the visual difference.
Part C(iii): Predict production of closure-inducing molecules
-
Establish the nonmutated response.
In nonmutated plants, Ap4A reduces relative stomatal size from about \(1.00\) to \(0.65\), indicating activation of a closing pathway.
-
Compare the mutant response.
In DORN1 mutants, Ap4A does not reduce stomatal size; the value remains near or above the buffer value.
-
Connect receptor loss to downstream output.
If DORN1 activation normally induces closure molecules, losing the Ap4A response predicts reduced production of those downstream molecules.
Part D(i): Predict defense-gene transcription with a truncated receptor
-
Separate receptor binding from signal relay.
A membrane receptor needs an extracellular ligand-binding region and an intracellular region that interacts with signaling proteins.
-
Apply the deletion.
The truncated receptor may still bind Ap4A outside the cell, but it cannot efficiently activate the intracellular signaling cascade.
-
Predict the transcriptional result.
Without effective signal transmission to transcription factors, defense-gene transcription should be much lower than in nonmutated cells.
Part D(ii): Justify the transcription prediction
-
Locate the required receptor function.
The intracellular domain relays receptor activation to cytoplasmic signaling proteins and ultimately to transcription factors.
-
Explain the causal consequence.
Removing most of that domain prevents Ap4A binding from being efficiently transmitted into the cell, so the defense genes are not strongly activated.
Free-response question 2
siRNA, AGO2, mRNA cleavage, and gene regulation
Gene expression and data analysis| Gene | \(AGO2^{+/+}\) | \(AGO2^{+/-}\) | \(AGO2^{-/-}\) |
|---|---|---|---|
| Gene G | \(1.0\pm0.1\) | \(0.9\pm0.4\) | \(1.5\pm0.5\) |
| Gene H | \(1.0\pm0.1\) | \(2.0\pm0.1\) | \(3.0\pm0.4\) |
Part A: Identify one location of eukaryotic ribosomes
-
Recall the two standard locations.
Free ribosomes occur in the cytosol and synthesize many cytosolic proteins. Other ribosomes attach to the cytosolic surface of the rough endoplasmic reticulum and synthesize proteins entering the endomembrane system.
-
Give either acceptable location.
The question requires only one; including both is still biologically correct.
Part B(i): Construct the grouped bar graph
-
Set up the axes.
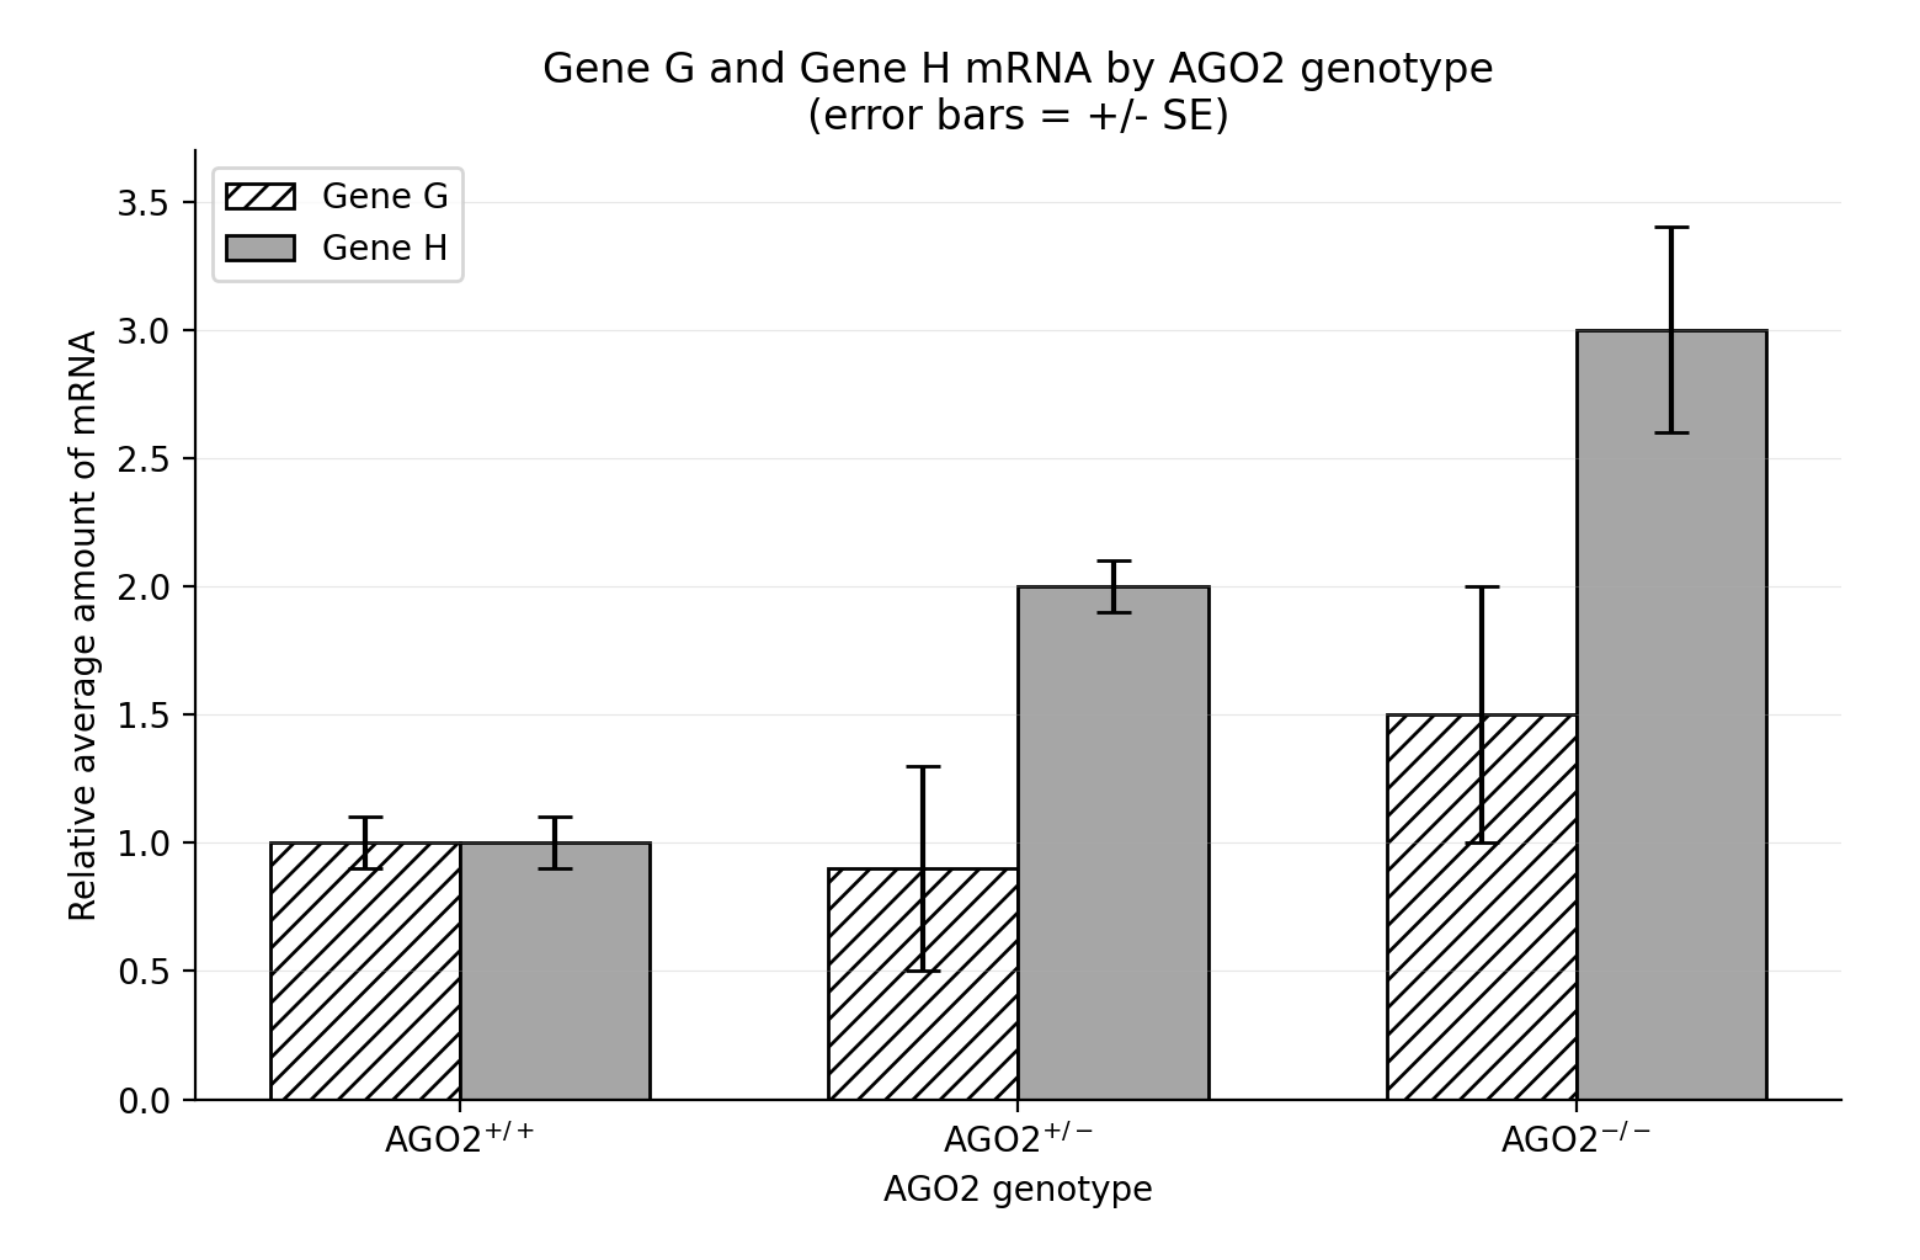
Place the three AGO2 genotypes on the horizontal axis. Label the vertical axis “relative average amount of mRNA” and begin it at zero.
-
Choose a sufficient vertical scale.
The axis must extend above (3.4) so the largest mean plus its error bar fits.
-
Plot both genes.
Draw one Gene G bar and one Gene H bar for each genotype at the means in the table.
-
Add uncertainty and identification.
Add error bars equal to the stated standard errors and include a legend that distinguishes Gene G from Gene H.
Part B(ii): Identify Gene G groups visually consistent with \(AGO2^{+/+}\)
-
Convert each mean and SE to a displayed interval.
\[ \begin{aligned} AGO2^{+/+}&:1.0\pm0.1=[0.9,1.1]\\ AGO2^{+/-}&:0.9\pm0.4=[0.5,1.3]\\ AGO2^{-/-}&:1.5\pm0.5=[1.0,2.0] \end{aligned} \] -
Check overlap with the wild-type range.
Both the heterozygous interval and the homozygous-nonfunctional interval overlap the (AGO2^{+/+}) interval.
Part C(i): Relate wild-type copy number to Gene H mRNA
-
Read the three Gene H means.
Two wild-type copies give (1.0), one wild-type copy gives (2.0), and zero wild-type copies gives (3.0).
-
State the relationship.
Gene H mRNA increases as the number of functional AGO2 copies decreases.
-
Connect the pattern to function.
The inverse relationship is consistent with functional AGO2 promoting cleavage and removal of Gene H mRNA.
Part C(ii): Calculate the percent increase in Gene H mRNA
-
Identify the original and new values.
The original value is (2.0) in (AGO2^{+/-}) cells, and the new value is (3.0) in (AGO2^{-/-}) cells.
-
Apply the percent-increase formula.
\[ \text{Percent increase}=\frac{\text{new}-\text{original}}{\text{original}}\times100 =\frac{3.0-2.0}{2.0}\times100=50\%. \]
Part D(i): Evaluate stronger regulation of Gene H
-
Compare Gene H in wild type and null cells.
Gene H rises from (1.0) in (AGO2^{+/+}) cells to (3.0) in (AGO2^{-/-}) cells, a threefold increase.
-
Use the displayed uncertainty.
The Gene H error bars for the three genotypes do not overlap, so the genotype-dependent differences are visually clear.
-
Contrast Gene G.
Gene G changes only from (1.0) to (1.5), and all displayed Gene G error-bar ranges overlap.
-
Make the regulatory conclusion.
Loss of AGO2 has a much larger effect on Gene H mRNA abundance than on Gene G.
Part D(ii): Explain how \(AGO2^{-/-}\) could block anaphase I
-
Identify the missing molecular action.
siRNA can bind a complementary target mRNA, but functional AGO2 is required to cleave that mRNA.
-
Predict the mRNA and protein consequence.
In (AGO2^{-/-}) cells, the target mRNA persists and remains available for translation, so the spindle-fiber stabilizing protein can accumulate.
-
Connect protein excess to chromosome movement.
Persistent stabilization prevents spindle fibers from changing as required to move homologous chromosomes to opposite poles during anaphase I.
Free-response question 3
Cyanide, cytochrome c oxidase, ATP, and lactic acid
Cellular respiration and controls| Group | Cyanide in medium? | Medium concentration |
|---|---|---|
| 1 | Yes | High |
| 2 | Yes | Low |
| 3 | No | High |
| 4 | No | Low |
Part A: Explain an advantage of aerobic respiration
-
Identify the limitation of glycolysis alone.
Glycolysis produces only a small net amount of ATP per glucose because much of the glucose's chemical energy remains in pyruvate.
-
Identify the additional aerobic pathways.
Aerobic respiration continues through pyruvate oxidation, the citric acid cycle, the electron transport chain, and chemiosmosis.
-
Explain the advantage.
These pathways oxidize glucose more completely and capture much more of its energy as ATP.
Part B: Identify the control groups
-
Identify the factor of interest.
The experimental factor is cyanide released into the bacterial medium.
-
Find the no-cyanide comparisons.
Groups 3 and 4 use medium from bacteria that do not produce cyanide.
-
Explain why both concentrations are needed.
Using high- and low-concentration no-cyanide media controls for medium concentration and for other substances in the bacterial medium.
Part C: Predict the group with the highest ATP production
-
Rule out the high-cyanide group.
High cyanide greatly decreases CCO activity, so Group 1 should have reduced electron transport and ATP production.
-
Establish the no-cyanide baseline.
Groups 3 and 4 should have normal CCO activity with respect to cyanide.
-
Use the low-cyanide effect.
The prompt reports that low cyanide slightly increases CCO activity. Group 2 is the low-cyanide treatment, so it is predicted to have the highest ATP production.
Part D: Explain why CCO inhibition increases lactic acid
-
Block electron flow.
CCO transfers electrons near the end of the mitochondrial electron transport chain. Inhibiting CCO slows or stops electron flow.
-
Reduce oxidative phosphorylation.
Lower electron flow reduces proton pumping, weakens the proton gradient, and decreases ATP synthesis by ATP synthase.
-
Increase dependence on glycolysis.
To maintain ATP production, the cells rely more heavily on glycolysis.
-
Regenerate the oxidized electron carrier.
Glycolysis requires (NAD^+). Reducing pyruvate to lactate regenerates (NAD^+) from (NADH), allowing glycolysis to continue.
-
State the final outcome.
Greater use of this pathway increases lactate, or lactic acid, production.
Free-response question 4
Meiosis, nondisjunction, gene dosage, and triploidy
Cell division and chromosome inheritance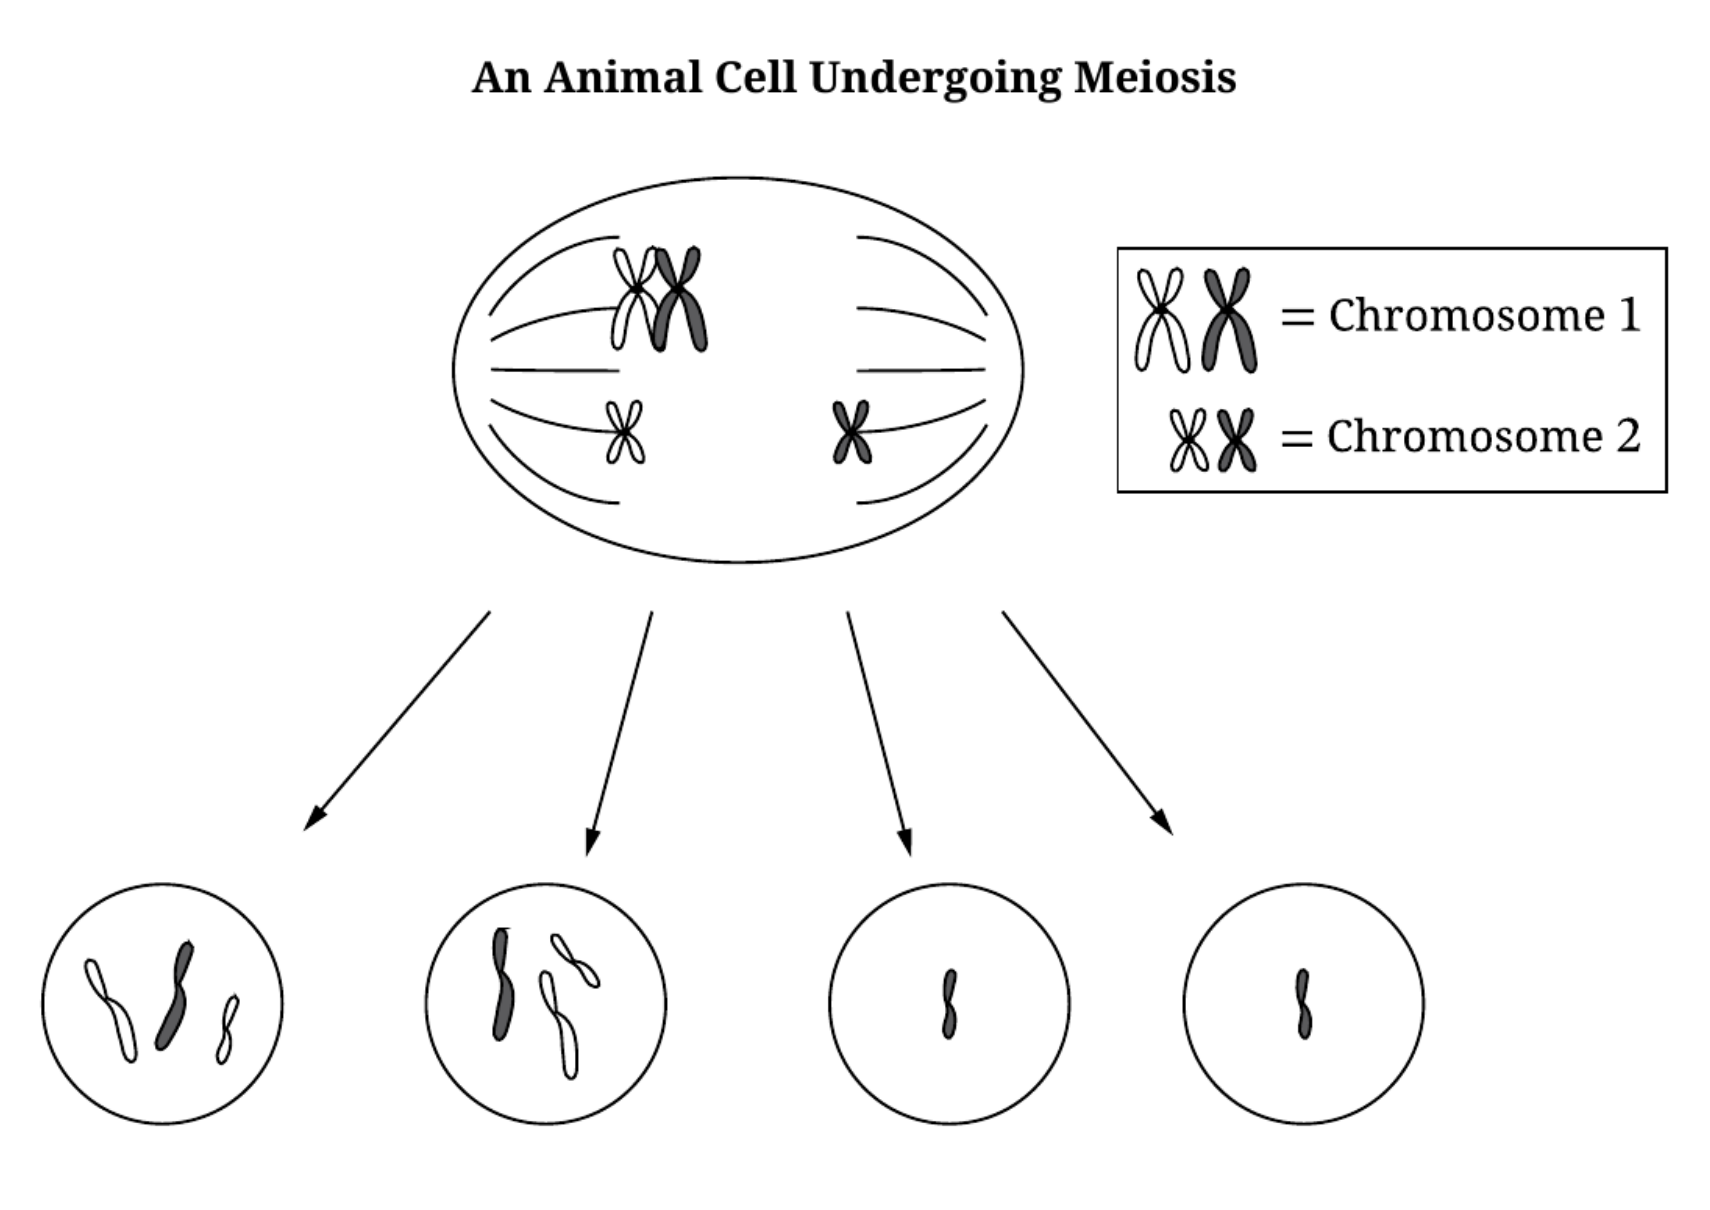
Part A: Describe chromosome movement in Meiosis I
-
Start with homolog pairing.
Homologous chromosomes pair during prophase I and align as homologous pairs at metaphase I.
-
Identify the anaphase I movement.
The two homologs move to opposite poles.
-
Distinguish sister chromatids.
Sister chromatids remain attached at their centromeres until Meiosis II.
Part B: Explain why chromosomes are more visible during division
-
Describe interphase chromatin.
During interphase, DNA is largely decondensed, allowing transcription and replication machinery to access it.
-
Describe division-stage chromatin.
Before and during mitosis or meiosis, chromatin coils and condenses into short, thick chromosomes.
-
Connect condensation to observation.
The compact, discrete structures are easier to distinguish with a light microscope than diffuse chromatin.
Part C: Predict mRNA production in the four zygotes
-
Read the abnormal gametes from left to right.
The first two gametes contain both homologs of Chromosome 1. The last two contain no Chromosome 1.
-
Add the normal fertilizing gamete.
A normal gamete contributes one copy of Chromosome 1 to every zygote.
-
Determine zygote copy number.
Zygotes 1 and 2 contain three copies of Chromosome 1. Zygotes 3 and 4 contain one copy.
-
Translate copy number into mRNA output.
Because regulation per copy is unchanged, total mRNA is proportional to gene copy number. The high-copy and low-copy zygotes therefore have a (3:1) output ratio.
| Zygotes | Chromosome 1 copies | Relative mRNA output |
|---|---|---|
| 1 and 2 | 3, trisomy | 3 units; 1.5 times normal |
| 3 and 4 | 1, monosomy | 1 unit; 0.5 times normal |
Part D: Explain why most triploid organisms cannot make normal gametes
-
Identify the triploid condition.
A triploid cell has three homologs of every chromosome.
-
Apply the pairing problem.
Three homologs cannot pair and divide evenly between two daughter cells during Meiosis I.
-
Describe likely segregation.
The homologs often form a trivalent or a pair plus one unpaired chromosome and segregate in a (2:1) pattern.
-
Scale the problem across the genome.
Irregular segregation occurs independently for many chromosome types, so most gametes receive unequal chromosome numbers.
Free-response question 5
Storms, toe pads, natural selection, and speciation
Evolution and geographic isolation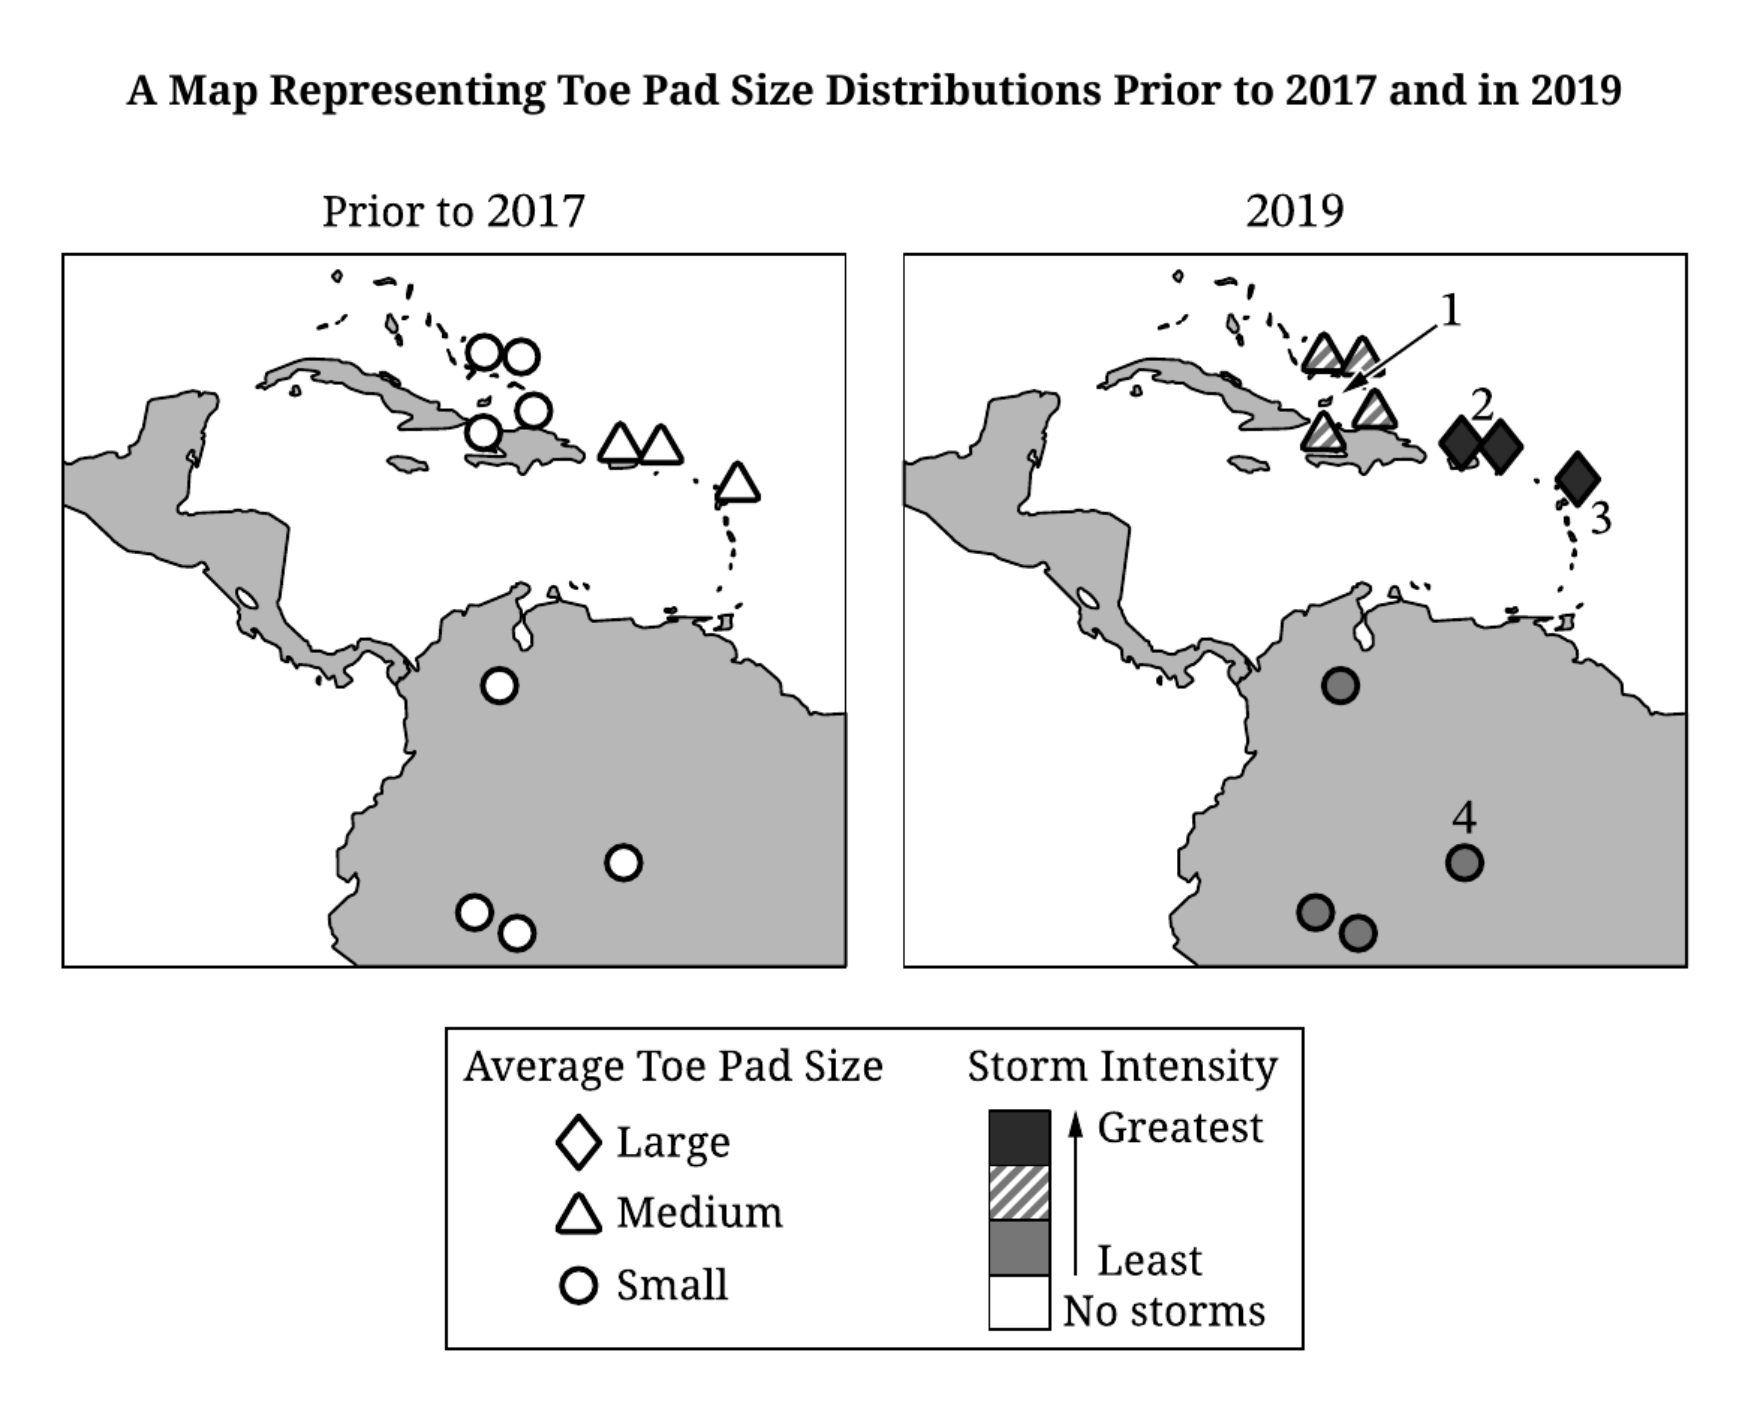
Part A: Explain the role of abiotic change in natural selection
-
Define the relevant environmental factor.
Abiotic factors are nonliving conditions such as wind intensity, temperature, water availability, or salinity.
-
Change the selective pressure.
A change in an abiotic factor alters which phenotypes are most likely to survive and reproduce.
-
Require heritability and differential reproduction.
If the advantageous phenotype is heritable, individuals carrying its alleles contribute more offspring to the next generation.
-
State the population-level outcome.
Over generations, advantageous alleles increase in frequency, changing the population.
Part B: Describe the relationship between storm intensity and toe-pad size
-
Decode the map.
Symbol fill represents storm intensity, and symbol shape represents average toe-pad size.
-
Compare low- and high-intensity regions.
No-storm or least-intense regions are associated mainly with small toe pads, while more intense storms are associated with medium or large toe pads.
-
State the relationship.
The data show a positive association: average toe-pad size tends to increase as storm intensity increases.
-
Explain a plausible selective mechanism.
Larger toe pads can improve a lizard's ability to cling to trees during strong winds. Lizards carrying larger-pad alleles are more likely to survive severe storms and reproduce.
Part C: Identify the region with the least storm intensity
-
Distinguish “least” from “none.”
The legend shows gray fill for the least storm intensity and white fill for no storms.
-
Find the numbered gray symbol.
Region 4 has the gray fill corresponding to the least storm intensity.
Part D: Explain how divergent selection could lead to speciation
-
Establish different selective pressures.
Different islands experience different storm intensities. High-storm islands strongly favor larger toe pads, while that advantage is weaker on low- or no-storm islands and may carry trade-offs.
-
Limit gene flow.
The island populations are geographically separated, so fewer alleles move among them.
-
Allow genetic divergence to accumulate.
Continued selection changes allele frequencies differently among islands. Mutation, drift, and selection can add further differences.
-
Reach reproductive isolation.
If accumulated differences produce prezygotic or postzygotic barriers, the populations can no longer interbreed successfully and become separate species.
Free-response question 6
Raptors, habitat conversion, keystone species, and resilience
Ecology and box-plot interpretation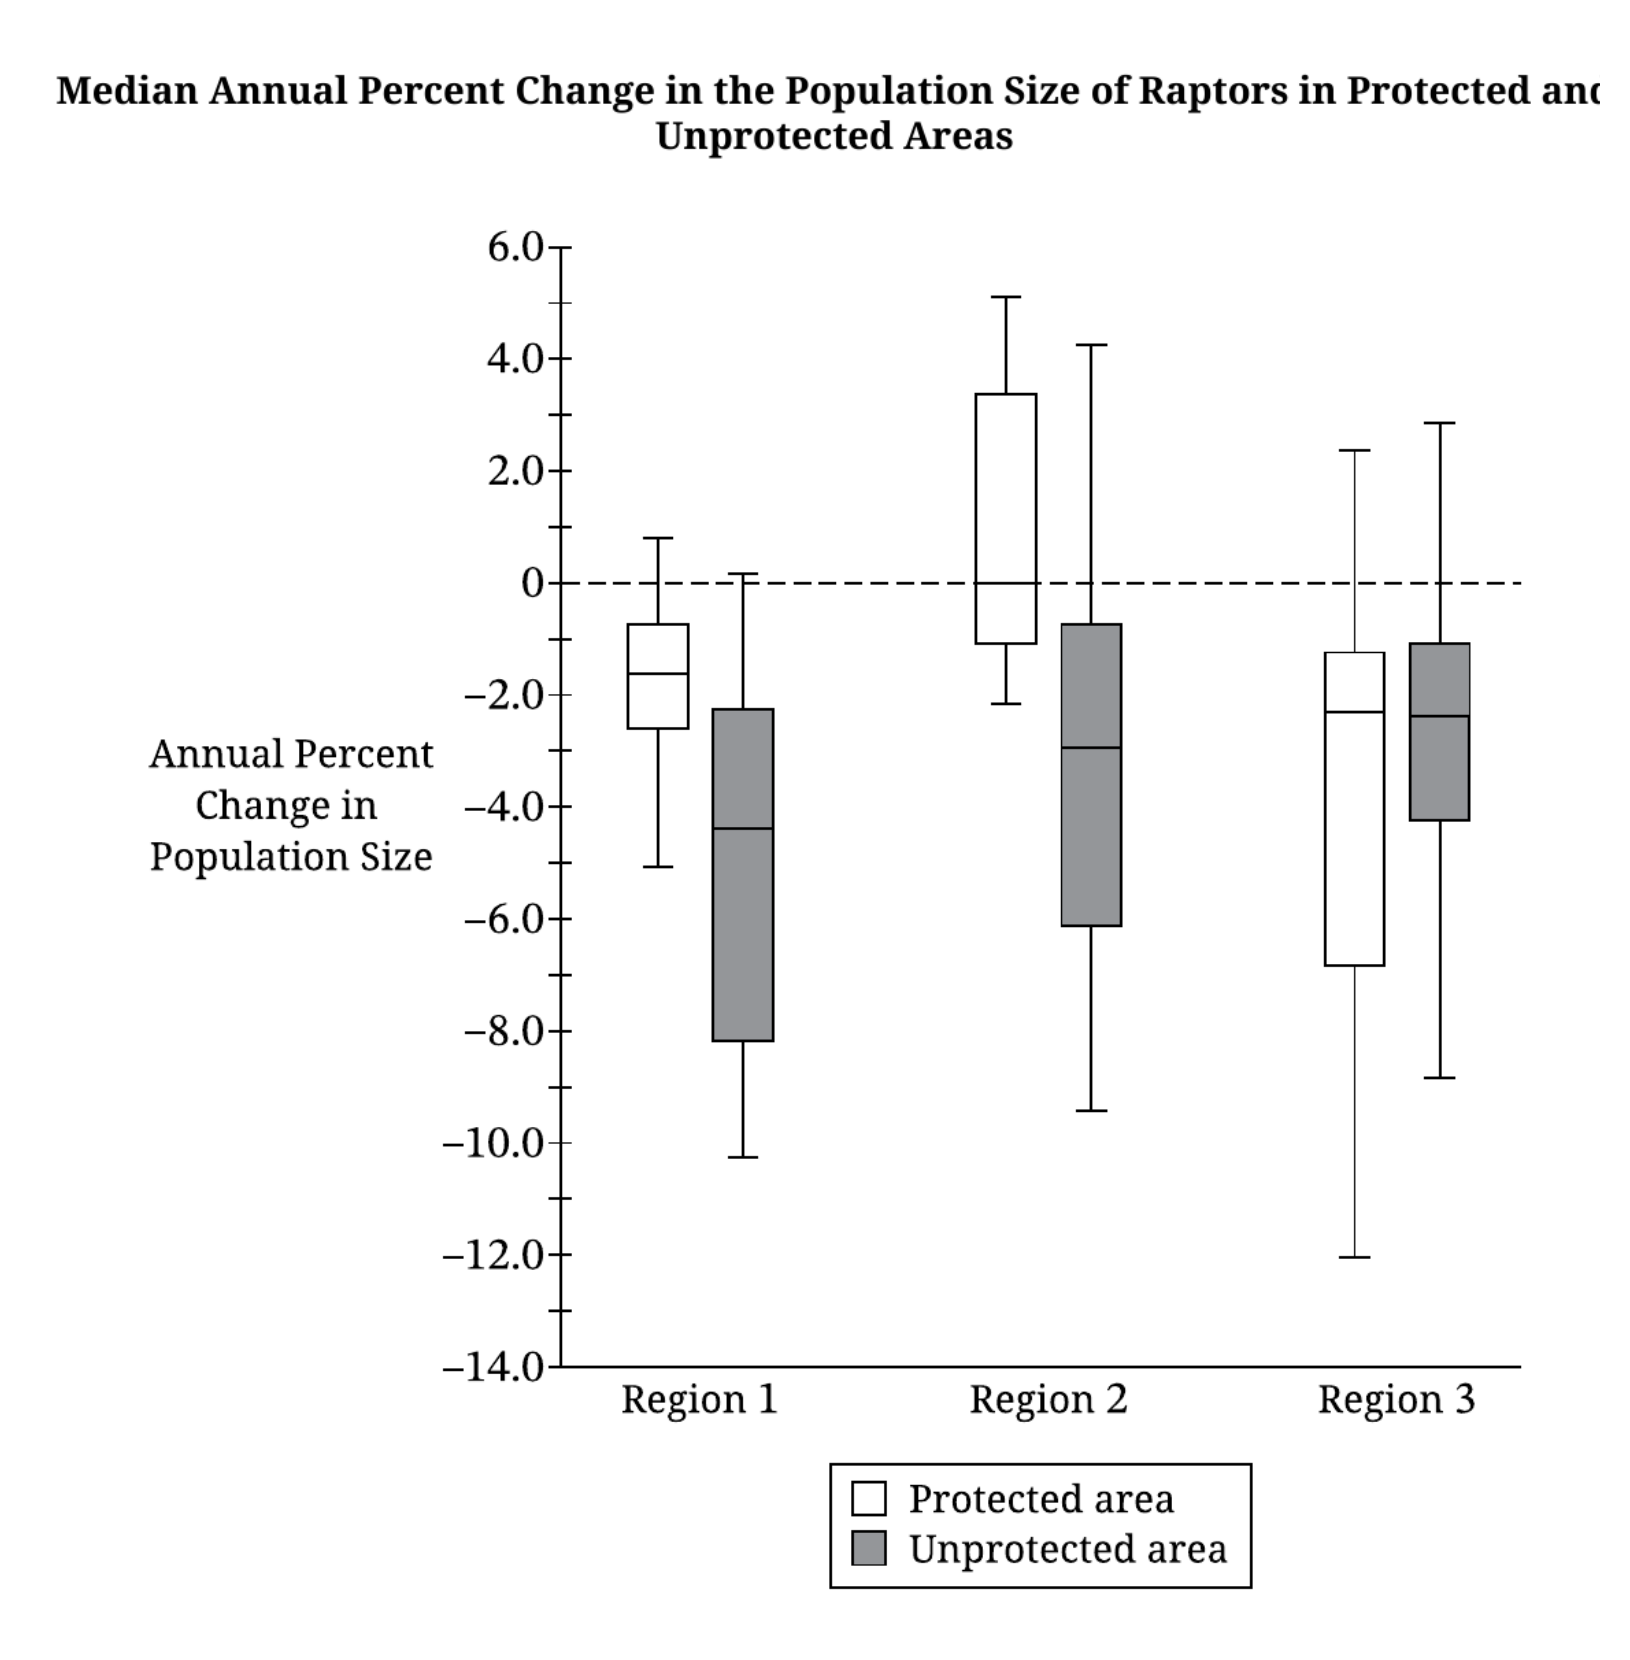
Part A: Read the median for unprotected Region 2
-
Select the unprotected box.
The legend identifies the gray box as the unprotected area, so use the gray box for Region 2.
-
Read the median line.
The horizontal median line lies halfway between \(-2\%\) and \(-4\%\).
Part B: Identify the greatest median annual percent change
-
Compare the horizontal median lines.
Most medians lie below the zero-change line.
-
Find the highest median.
The protected-area box for Region 2 has a median at approximately \(0\%\), higher than all the negative medians.
Part C: Evaluate the “no decline if farming is eliminated” hypothesis
-
Choose the relevant comparison.
The protected area of Region 2 is the best available comparison for an area without farming.
-
Use the medians as supporting evidence.
The protected median is approximately \(0\%\), while the unprotected median is approximately \(-3\%\). This supports the idea that eliminating farming would reduce the typical decline.
-
Use the negative protected values as limiting evidence.
Part of the protected-area distribution remains below zero, and its lower whisker is near \(-2\%\). Some protected observations therefore still show declines.
-
Recognize the observational limitation.
Protected and unprotected areas may differ in other ways, so the comparison does not isolate farming as the only cause.
Part D: Explain why ecosystem resilience may decline in unprotected areas
-
Begin with habitat conversion.
Farming converts and fragments natural habitat, reducing nesting sites, prey availability, and raptor survival.
-
Use the keystone-species concept.
Raptors are top predators and keystone species, so their decline can have effects that are disproportionately large relative to their abundance.
-
Trace the trophic cascade.
Reduced predation can allow some prey populations to increase, altering lower trophic levels and resource availability.
-
Connect biodiversity to resilience.
Habitat conversion and food-web disruption reduce biodiversity and functional redundancy. With fewer species performing ecological roles, the ecosystem is less able to resist or recover after disturbance.
Final AP Biology free-response checklist
- Answer the command word. Identify, describe, explain, predict, justify, and evaluate require different levels of reasoning.
- Use specific evidence. Include a value, trend, comparison, error bar, treatment, genotype, or diagram feature when the prompt provides data.
- Connect cause to mechanism to outcome. A correct vocabulary term alone is rarely enough for an explanation.
- Name what a control rules out. State the alternative explanation controlled by the comparison group.
- Keep natural selection population-level. Include heritable variation, differential reproductive success, and allele-frequency change.
- Separate glycolysis from fermentation. Glycolysis makes the ATP; fermentation regenerates \(NAD^+\).
- Avoid overclaiming. Use “supports,” “is consistent with,” or “partially supports” when the evidence is observational or incomplete.